
The price-to-earnings ratio of Microsoft is now equal to that of ExxonMobil. Exxon's P/E ratio has risen over the past six months from 14.6x to 21.4x, while Microsoft’s went in the other direction, falling from 32.3x. Or how about Amazon trading at 22x, roughly the broader market valuation, while Coca-Cola has climbed to 25x?
Growth and technology stocks have been rolling over; meanwhile, economically cyclical and defensive sectors are holding up the market. This year to date, the top-performing sectors in both Canada and the U.S. are Energy and Materials. Consumer Staples has also done extraordinarily well, up 14.5% so far this year in the U.S.
This is a different market than investors have gotten used to. Cyclicals and defensives are not supposed to be leading at the same time. From a factor standpoint, momentum remains strong, but close behind it are the dividend and value factors emerging as new market leaders. We even have a new acronym that has entered the investing lexicon: the HALO (Hard Asset, Low Obsolescence) trade. Suddenly, being reliable and a little boring is being rewarded. This is unusual, and it signals a meaningful shift underneath the headline volatility.
Factors (dividend and value) – Rotation has been the name of the game in the stock market this year. Grabbing many headlines in the technology space is the rotation out of software and into hardware, specifically anything to do with memory. But besides this rather narrow subset, there has been a much larger rotation in market leadership. It flipped from growth to value and dividend stocks in January and has accelerated dramatically in recent weeks.
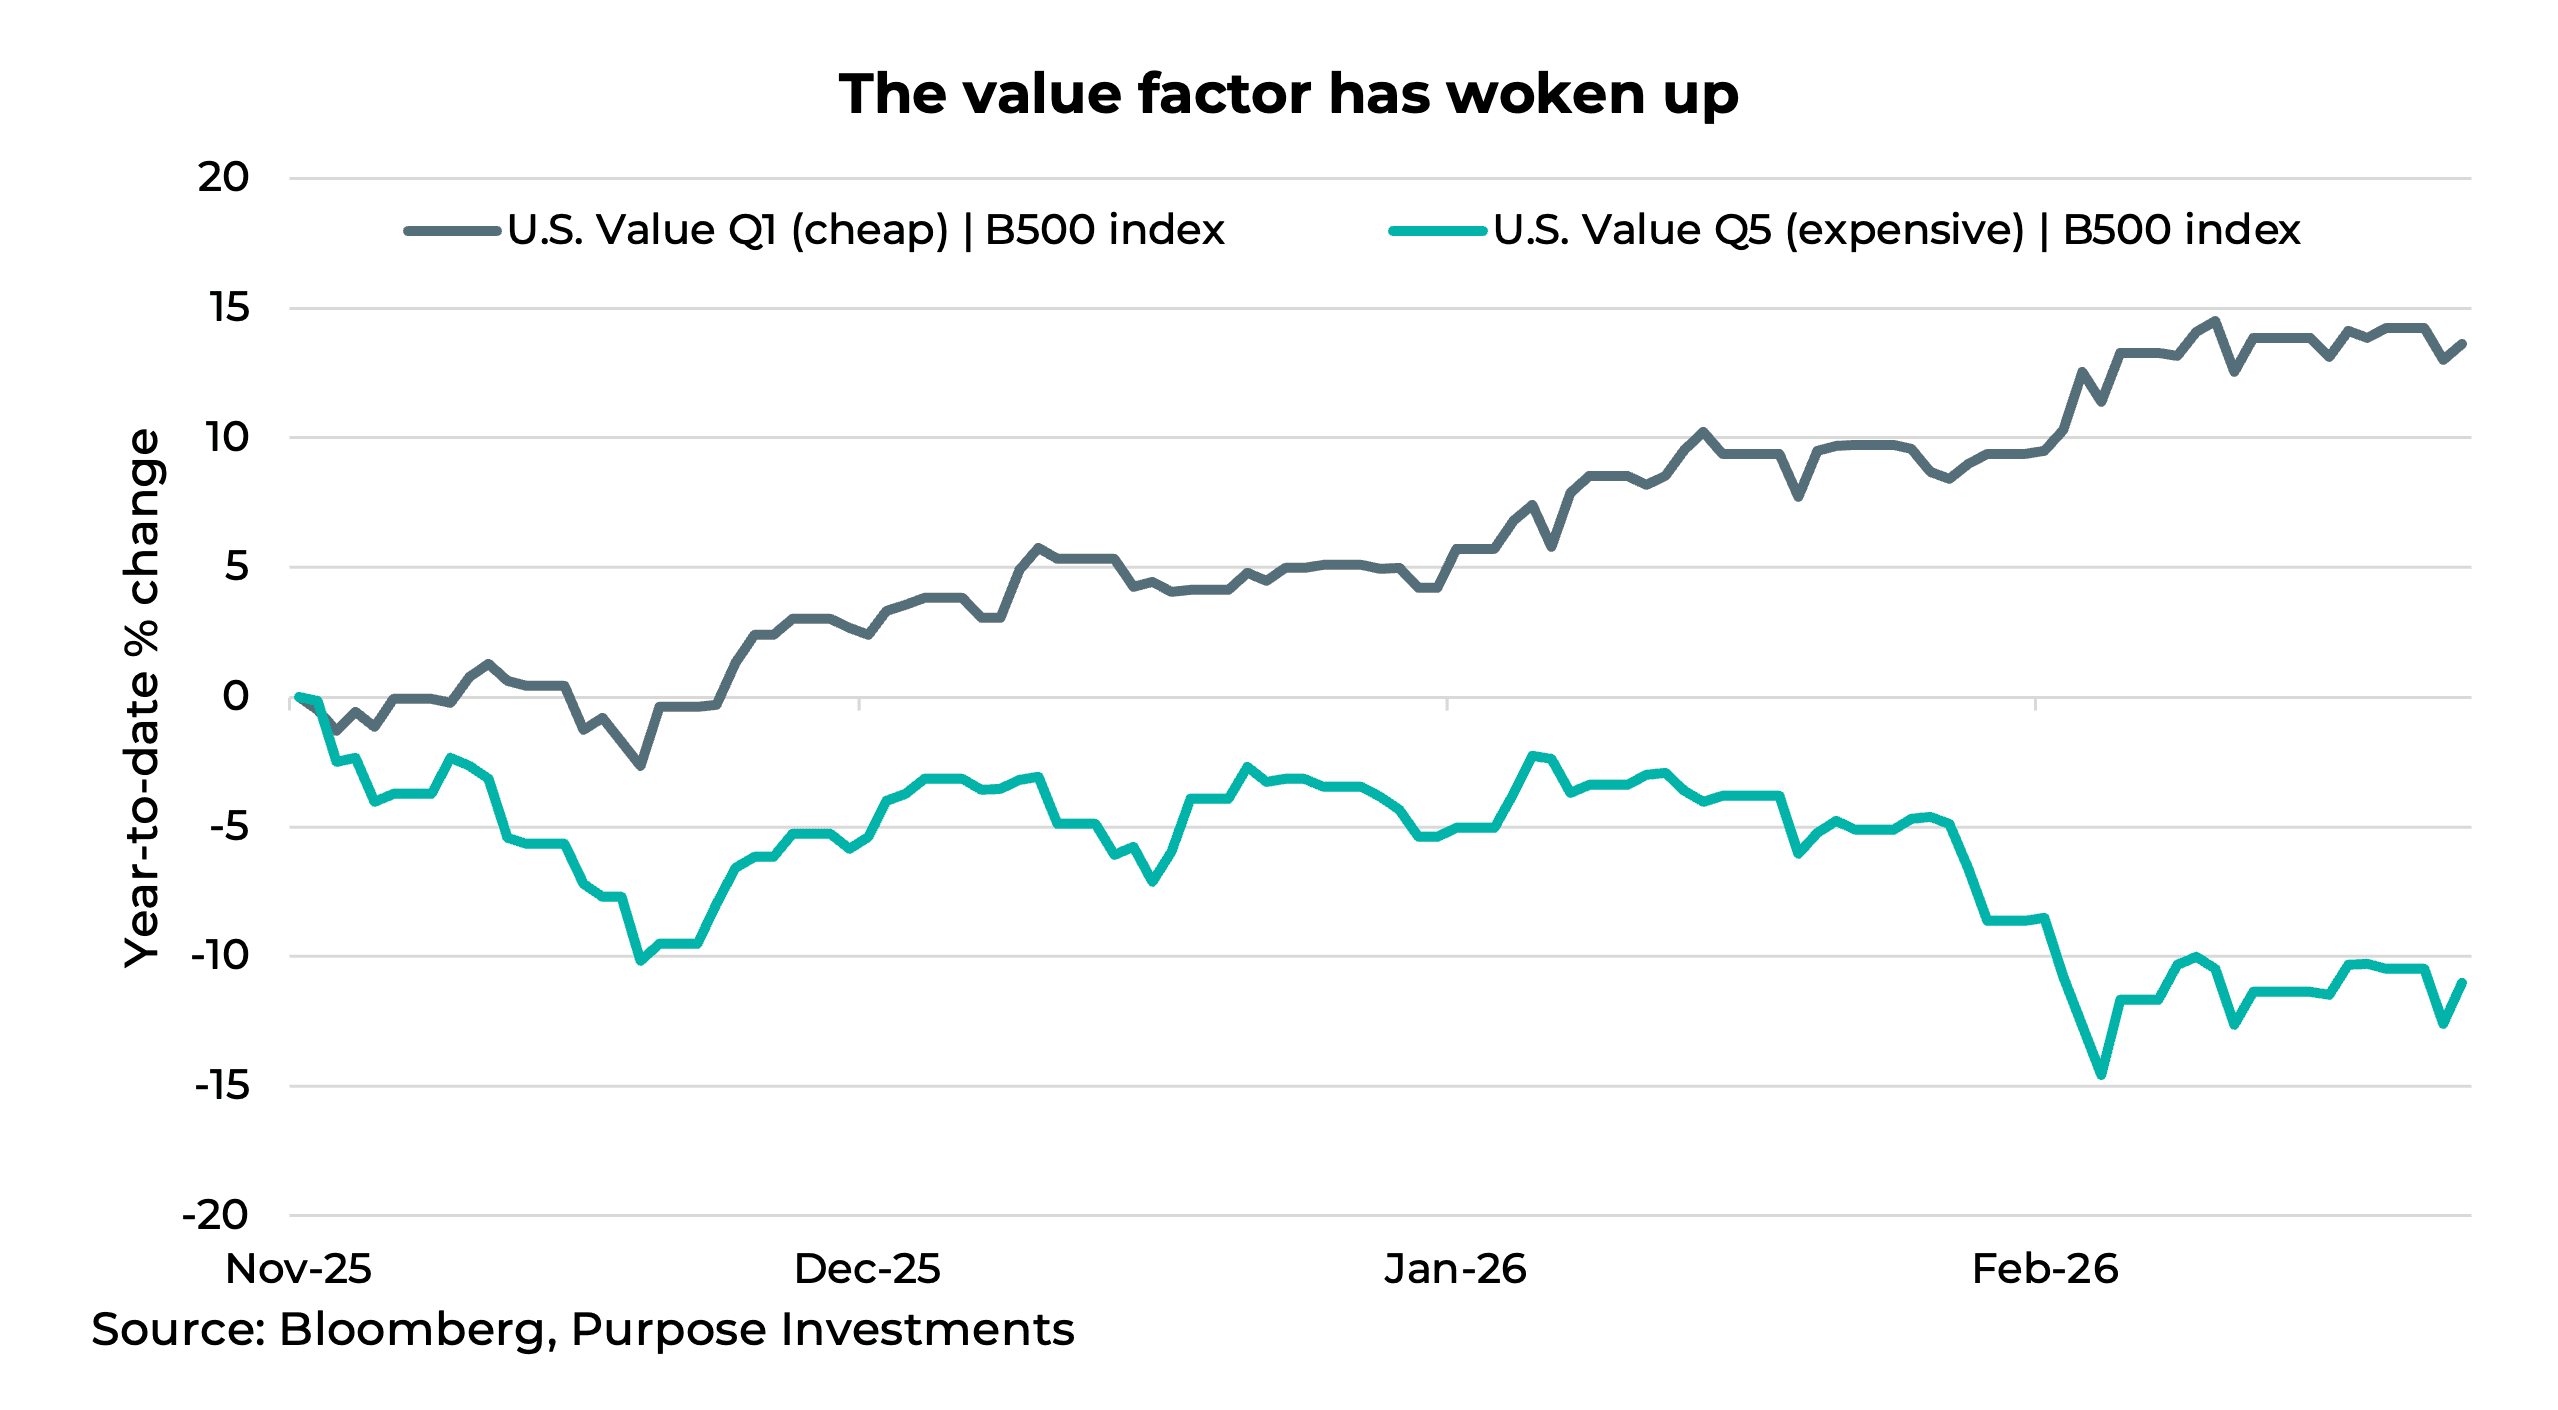
Since November, the cheapest stocks in the S&P 500 have outperformed the most expensive stocks in the index by over 20%, as seen in the chart below. Old school dividend stocks are back!!! Energy, utilities, pipelines, and staples have seen major inflows, pushing up prices and valuations. Behind the resurgence in dividend stocks is the dominance of value.
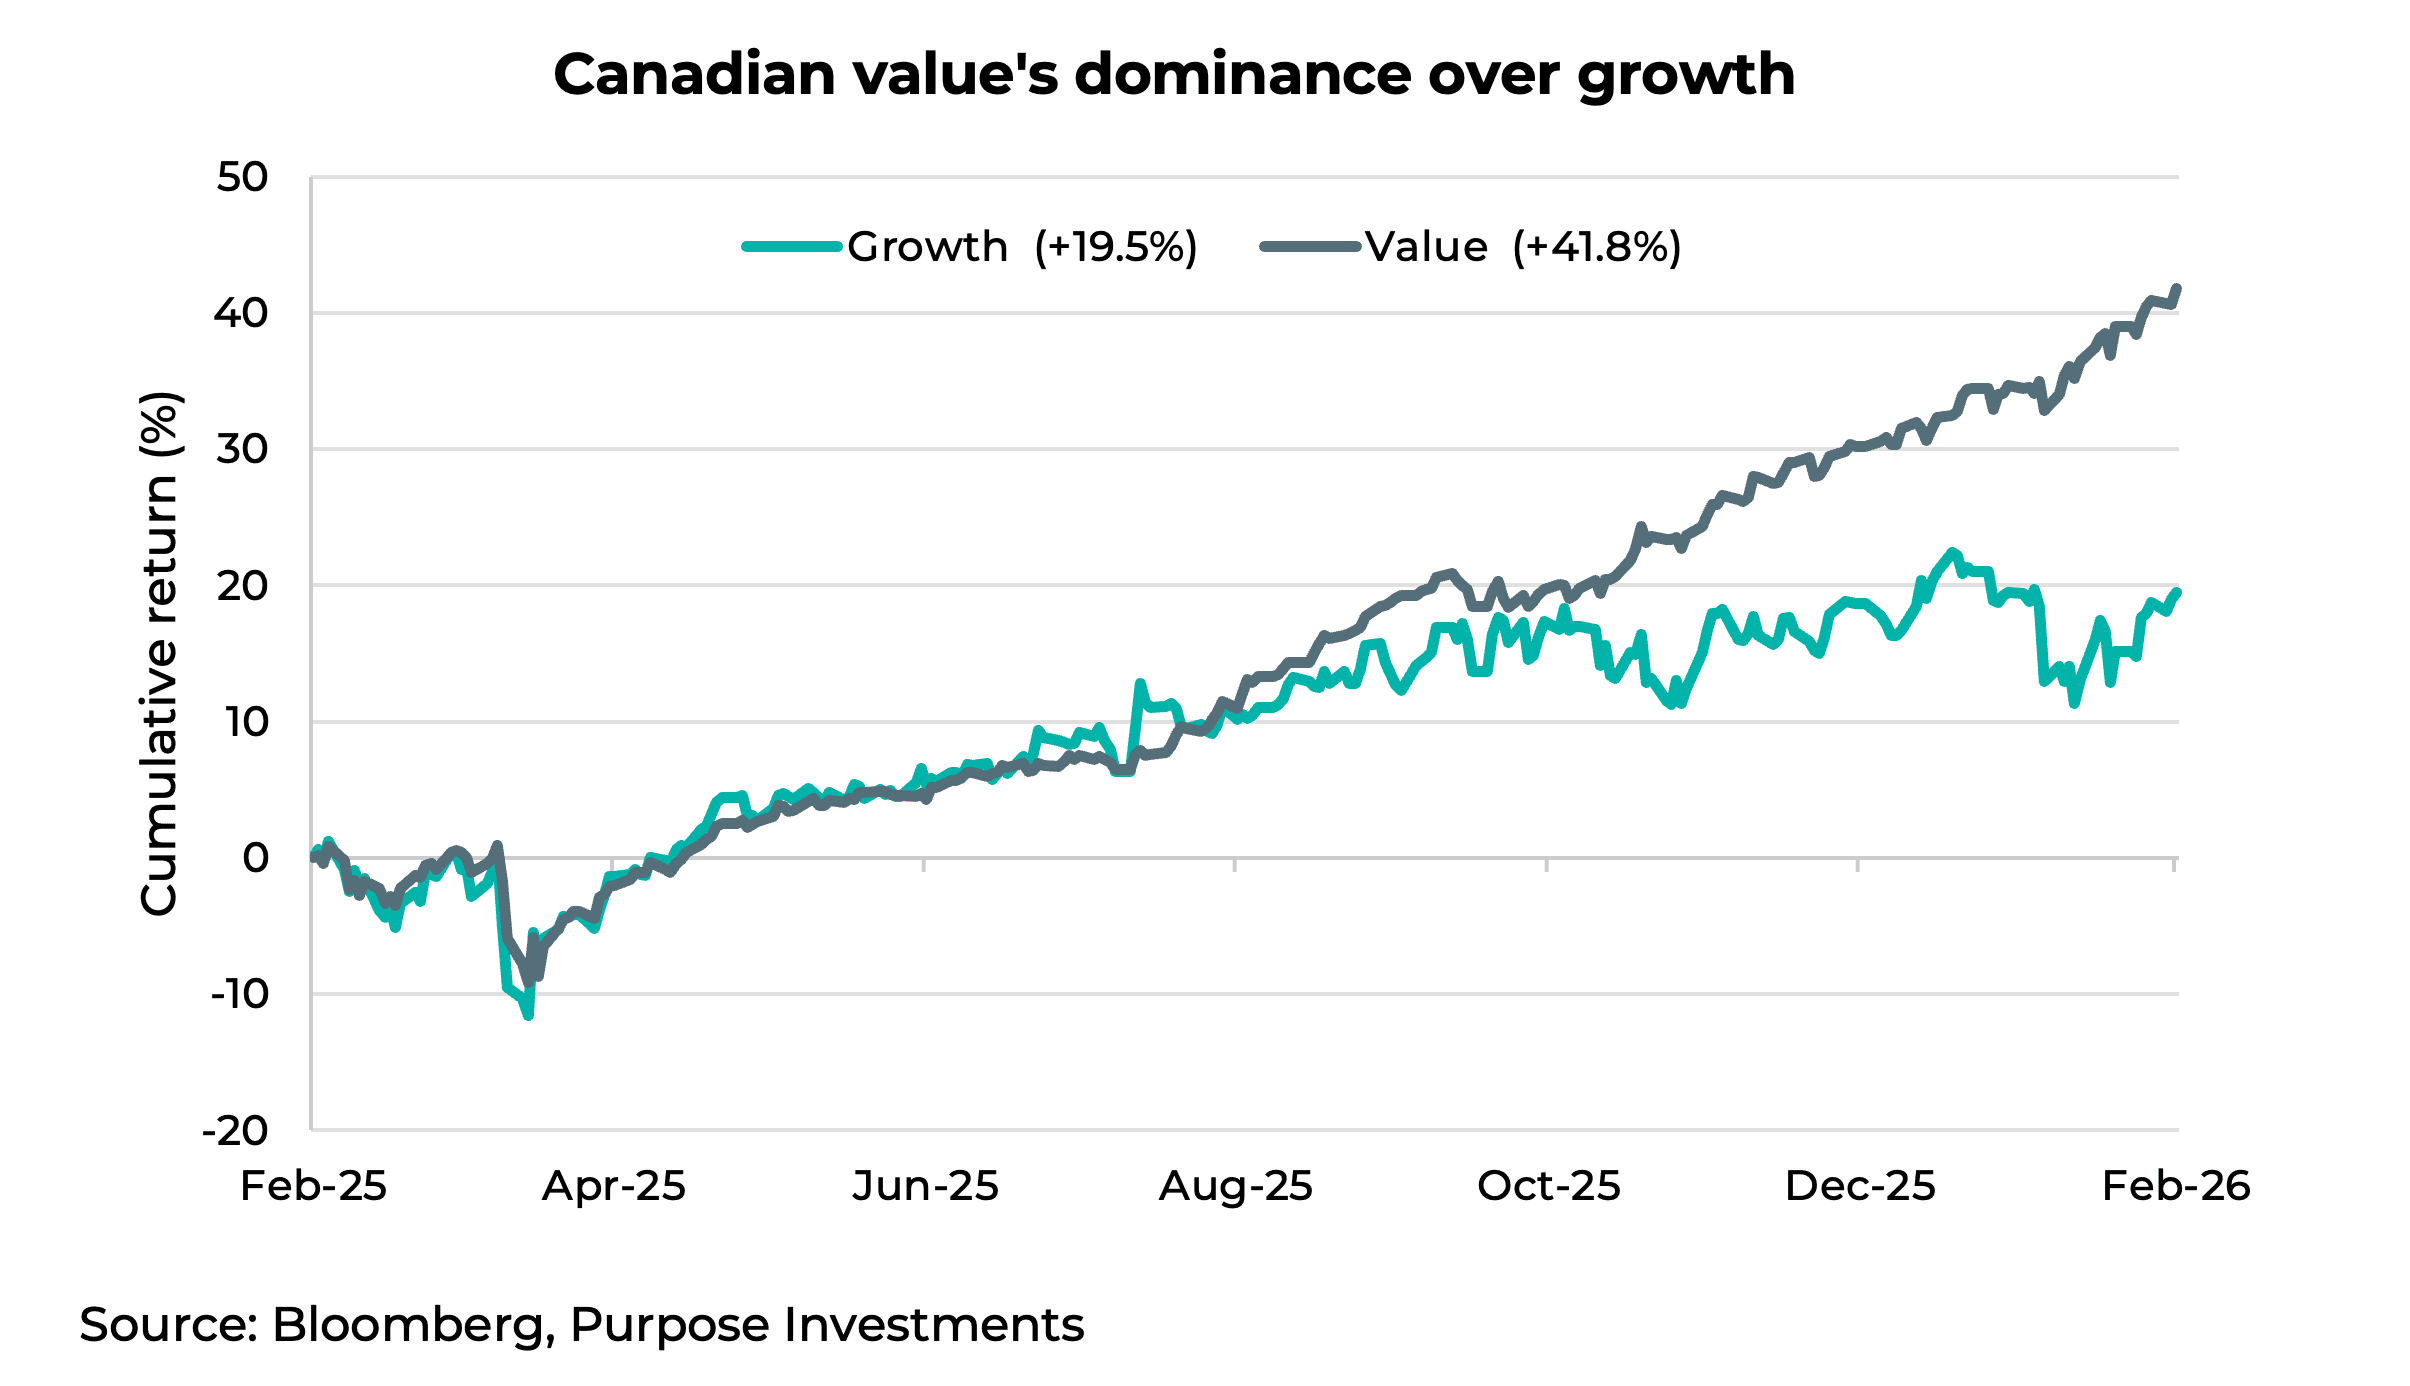
Rotation north of the 49th parallel – The rotation into value isn’t just a U.S. story. The chart below shows that the Canadian value index (dark line) significantly outperformed, rising 41.8% over the trailing year versus just 19.5% for growth. While still a solid return, growth's gain is less than half of value's.
As with the U.S., the divergence began at the end of October and has since widened considerably. Unlike with the U.S., it's not as much an AI/software story. Rather, value's heavy allocation to financials (54.9%) has been the largest tailwind. Energy is the second-largest weight in value at 24.2% and has contributed solid returns year to date. While gold miners have done their fair share for the growth index, a tilt toward tech and industrials has had a negative impact. What particularly stood out was that the Canadian growth index had a 13% exposure to Shopify, which has amplified the drag from tech’s underperformance. Growth's higher daily volatility has only compounded the pain.
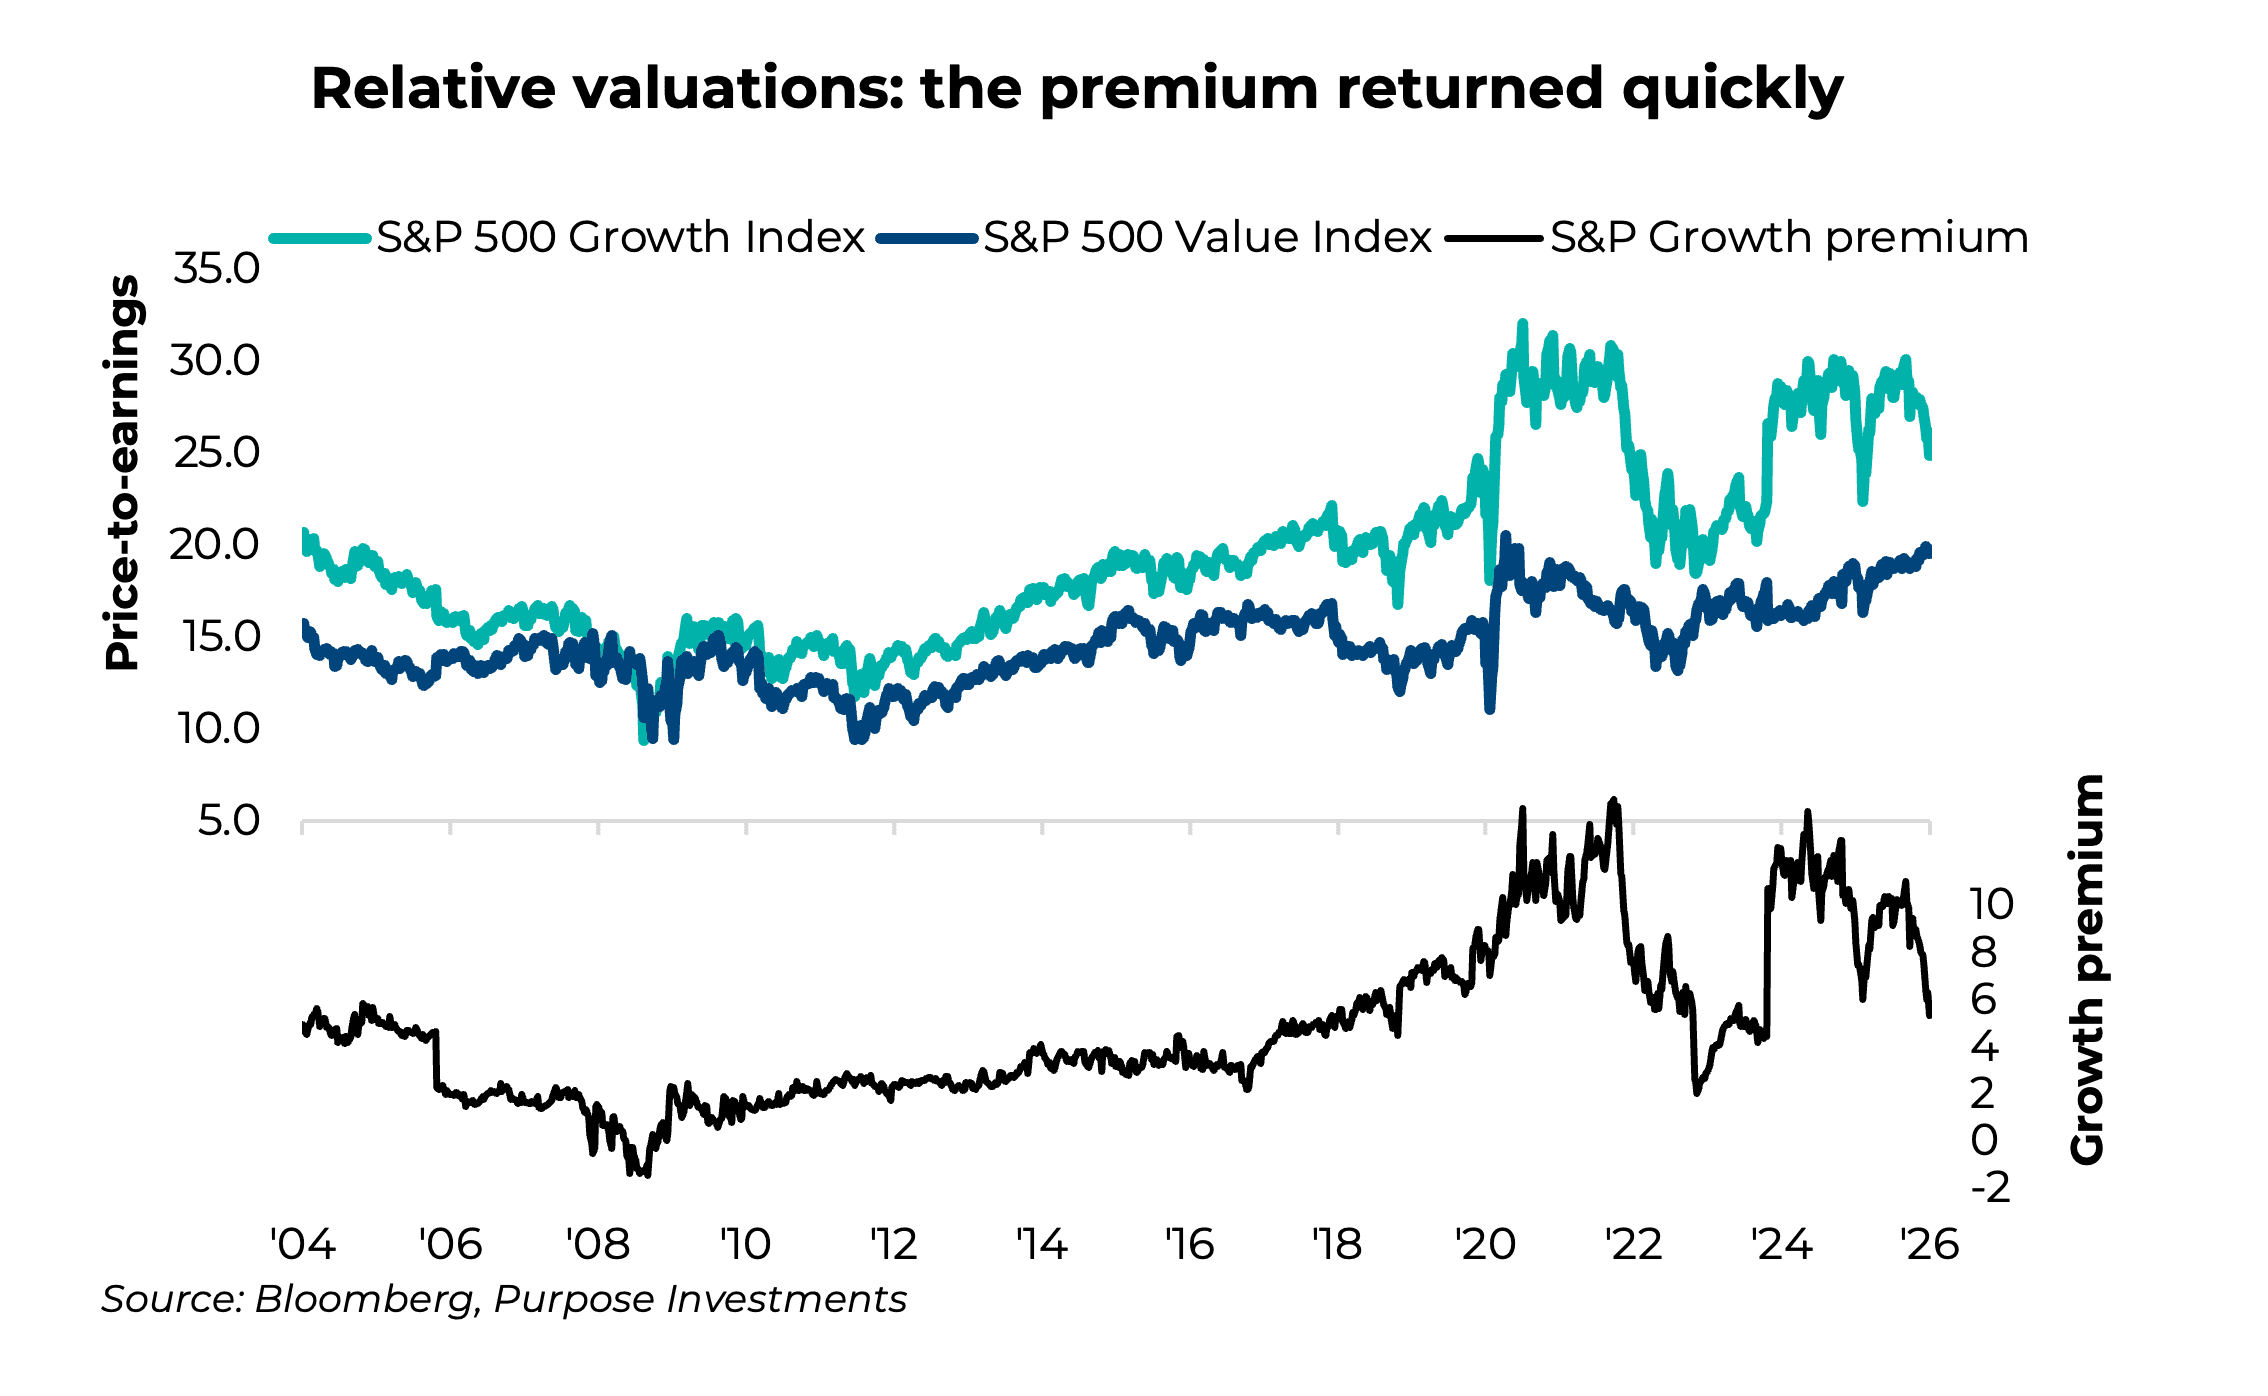
Valuations – While value has been winning, we're cognizant that previous bouts of outperformance have reversed course quickly. Below, we've charted the historical valuation premium of growth over value. While the S&P 500 Growth Index currently trades at a meaningful premium to the S&P 500 Value Index, hovering around a 5–6x point premium. This spread remains elevated by historical standards.
However, it’s noteworthy that the spread has halved since the end of October. Value has delivered strong relative performance, and we believe there is further runway as fundamentals continue to support the trade. That said, we remain vigilant. The experience of late 2022 serves as a reminder that the growth-to-value rotation can reverse sharply: the premium snapped back quickly as mega-cap growth reasserted leadership. Our approach is to continue riding the current wave of value outperformance while closely monitoring the spread for signs of inflection.
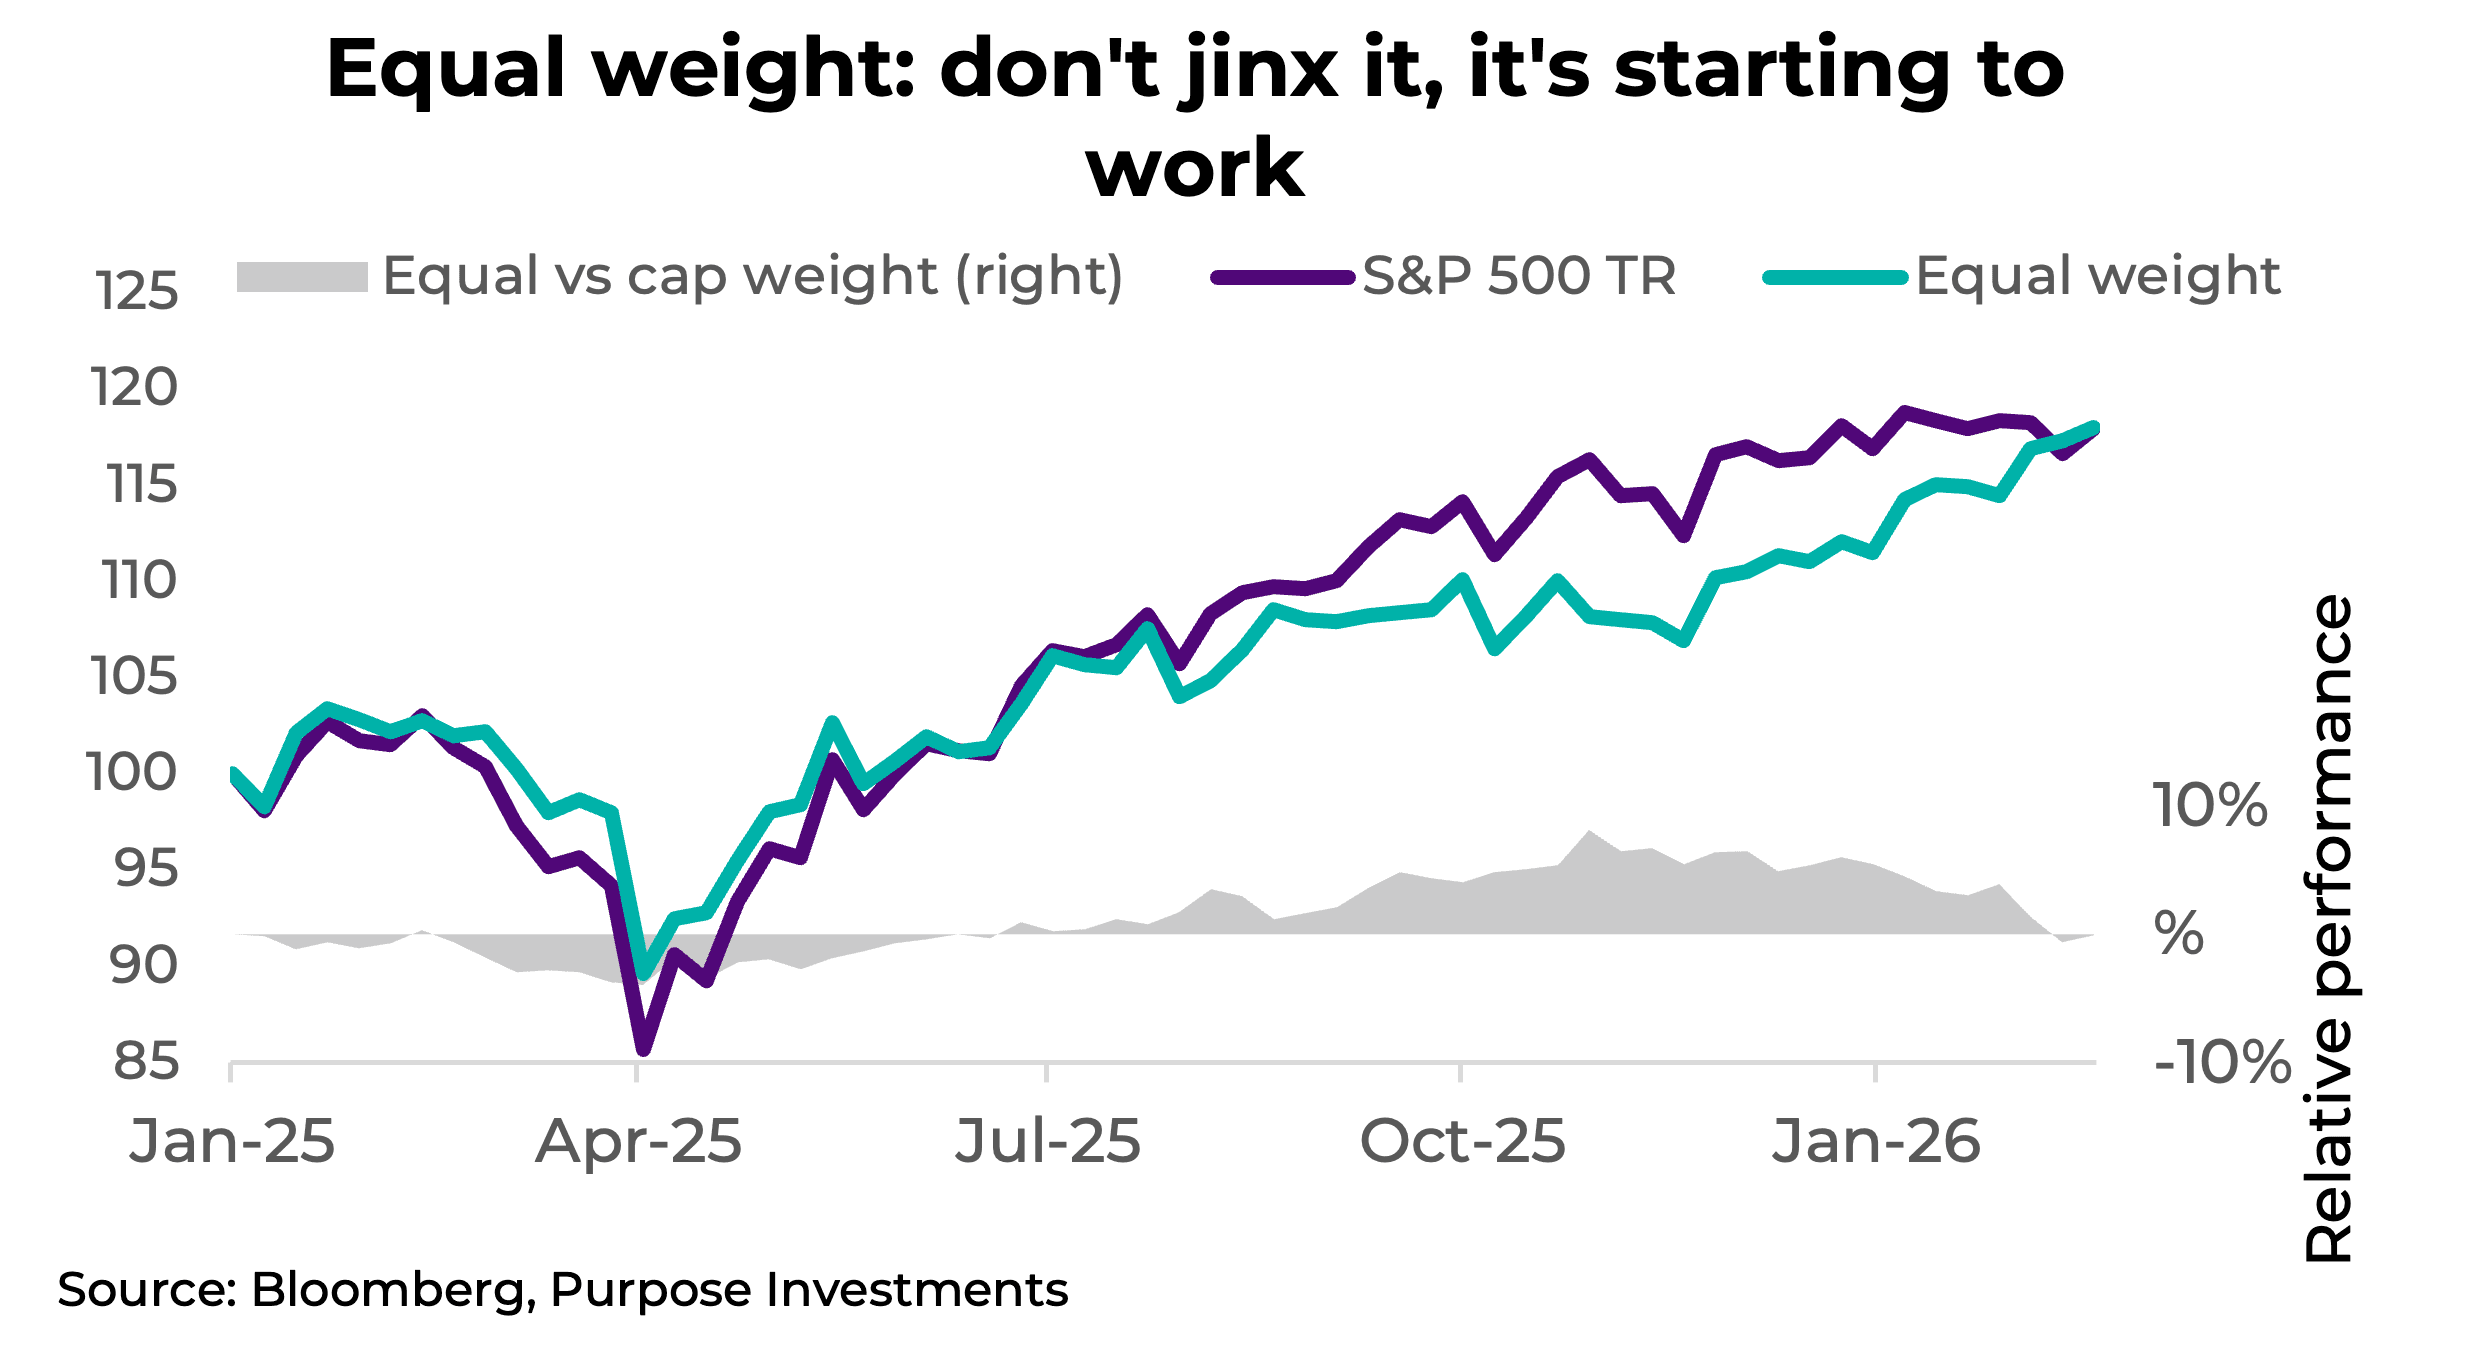
Equal weight remains a vehicle of choice – Besides outright factor-tilt ETFs, one of the ways to play the value/growth dynamic, at least in the U.S., is adding equal-weight exposure rather than plain vanilla cap-weighted S&P 500 exposure. The equal-weighted index has a much stronger value tilt compared to its cap-weighted equivalent, thanks largely to lower tech exposure and significantly more financials.
We've been proponents of equal-weight exposure for some time, to our detriment when tech was really running. After its recent outperformance, now 5.6% year to date, equal weight is tied with cap weight since the beginning of 2025. The valuation spread has narrowed by a third, to just 3.4 points from a high of 5.3 at the end of October. It's still historically wide, but close to the lowest levels seen over the past three years.
What we've been seeing is a consistent diversification away from legacy tech. Given that tech is nearly a third of the cap-weighted index, when it's running hot, cap weight will always win out. Over the longer term, historically, it's been more of a coin flip; the equal-weight index has outperformed in 18 of the past 36 years. In 2000, equal weight beat the S&P 500 by 18%. How long this lasts will depend on how the AI trade plays out.
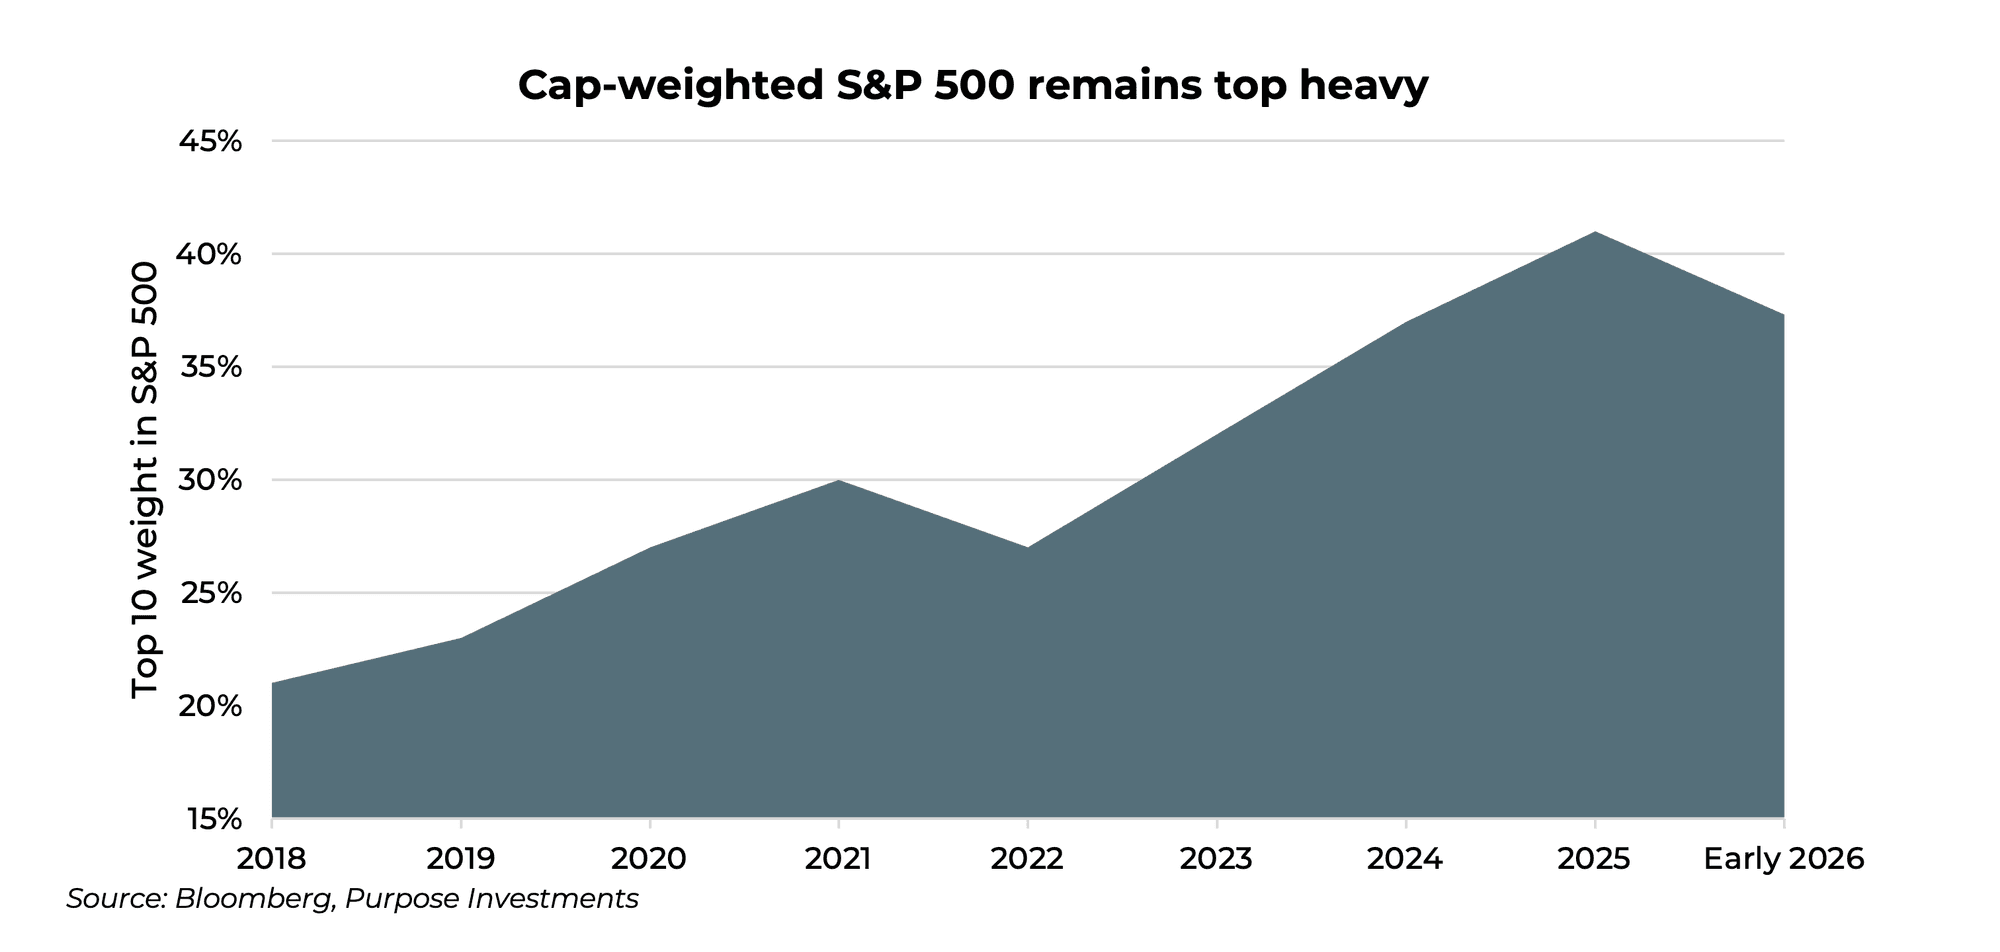
Besides valuations, the other main reason we continue to favour equal-weight exposure is reduced concentration risk. The S&P 500 remains very top-heavy. While off the highs of 41%, the current top-10 weight in the S&P 500 is still elevated at 37%. Should the mega-caps stumble, the cap-weighted index will shake a lot.
Seeking the Immunity Idol - Our guess is that there’s more to go in this rotation. Earnings do appear stretched for many cyclical stocks, but we're in an environment that should be constructive for deeper cyclicals, and we'd expect earnings growth to sort out what appear to be elevated valuations.
The HALO trade has been working. We're still on board and think there’s more room to run as investors continue to rotate capital out of high-growth tech and AI stocks. Investing in these 'old economy' stocks is the new momentum trade. It will continue to work until it doesn't, but in the meantime, there's something refreshing about owning solid businesses that don't require bold technological predictions well outside of most investors' core competency. Sometimes boring is good.
Or to put it another way, for the Survivor fans, HALO could be your portfolio's Immunity Idol. It won't last forever, but while the rest of the market figures out who AI is voting off the island, you're sitting in businesses that generate real cash flow and return it to shareholders. It's no coincidence that the resurgence in HALO stocks has gone hand in hand with renewed demand for dividend strategies. Hard assets and steady income tend to travel together.
What’s Fuelling an Improving Economy?
As we’ve noted, one of the tailwinds for markets in the second half of last year was firmer economic activity, which pushed down any talk of near-term recession risk. This helped markets post those great gains. Impressively, this improving economic trend has picked up even more in 2026. Providing a helping hand is manufacturing, one of the more cyclical components of the overall economy. Trends in PMI manufacturing surveys globally have been improving recently, and this accelerated this past month, including the U.S., which saw a huge increase in new orders.
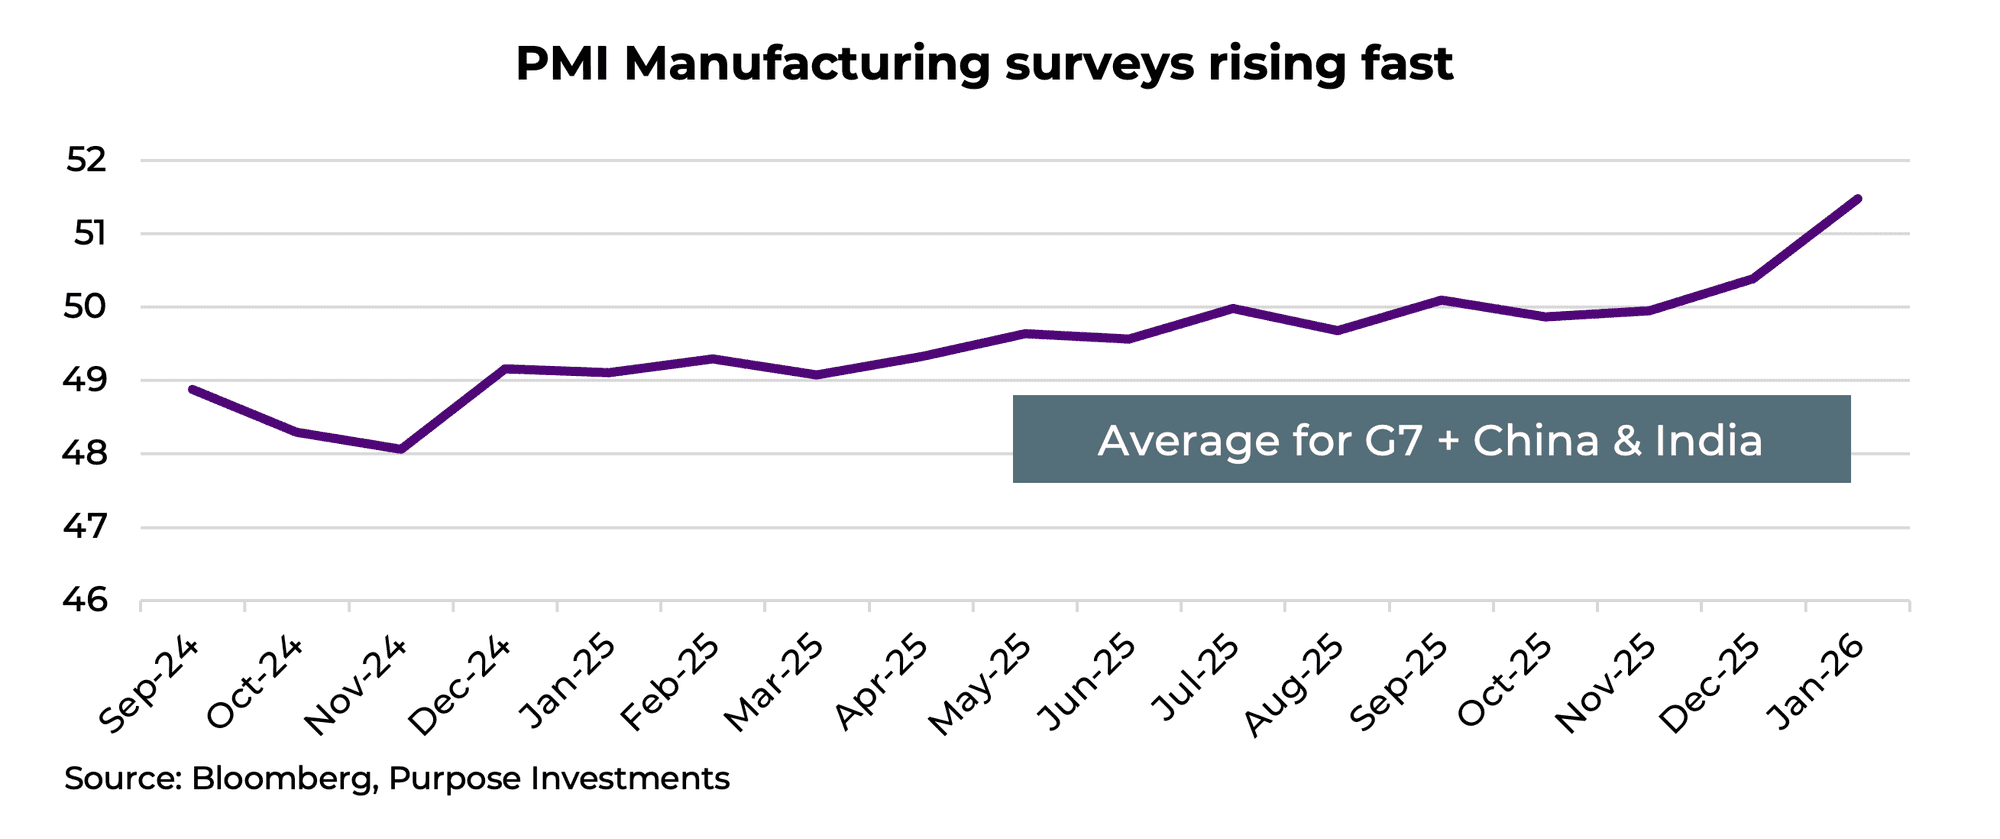
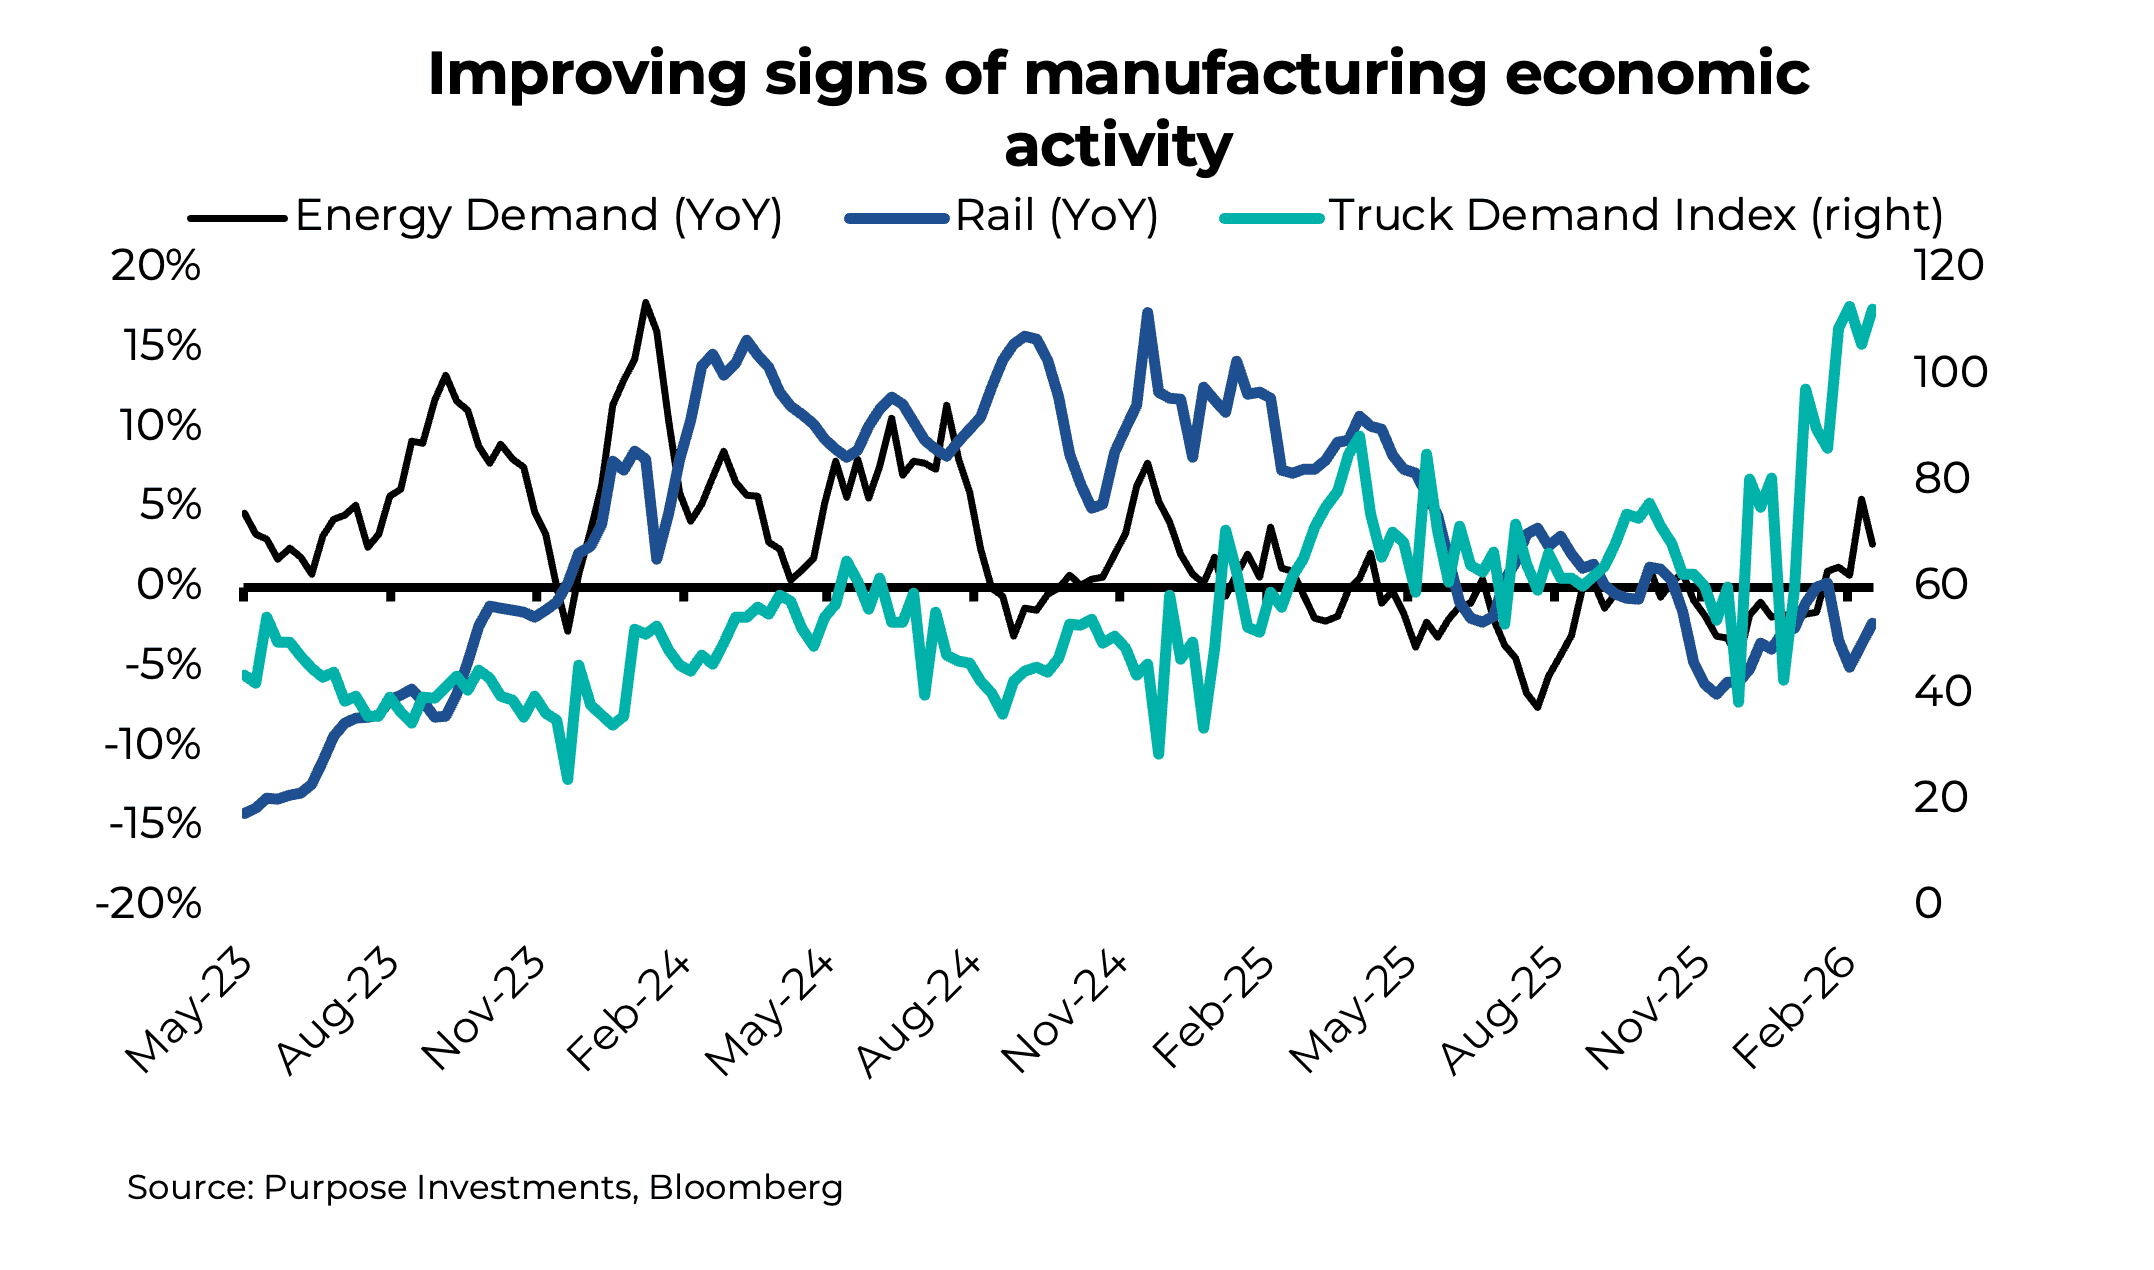
This is survey data, which is always worth noting. The PMI survey simply asks purchasing managers what their intentions are for the next month. Fortunately, this improved survey data is supported by a decent amount of hard data as well. In the U.S., energy demand has risen steadily over the past few months, which is often a sign of increasing economic activity in industrial production. Plus, trucking demand has jumped materially higher. Rail volumes of those intermodal containers have not improved yet, but port volumes are on the rise.
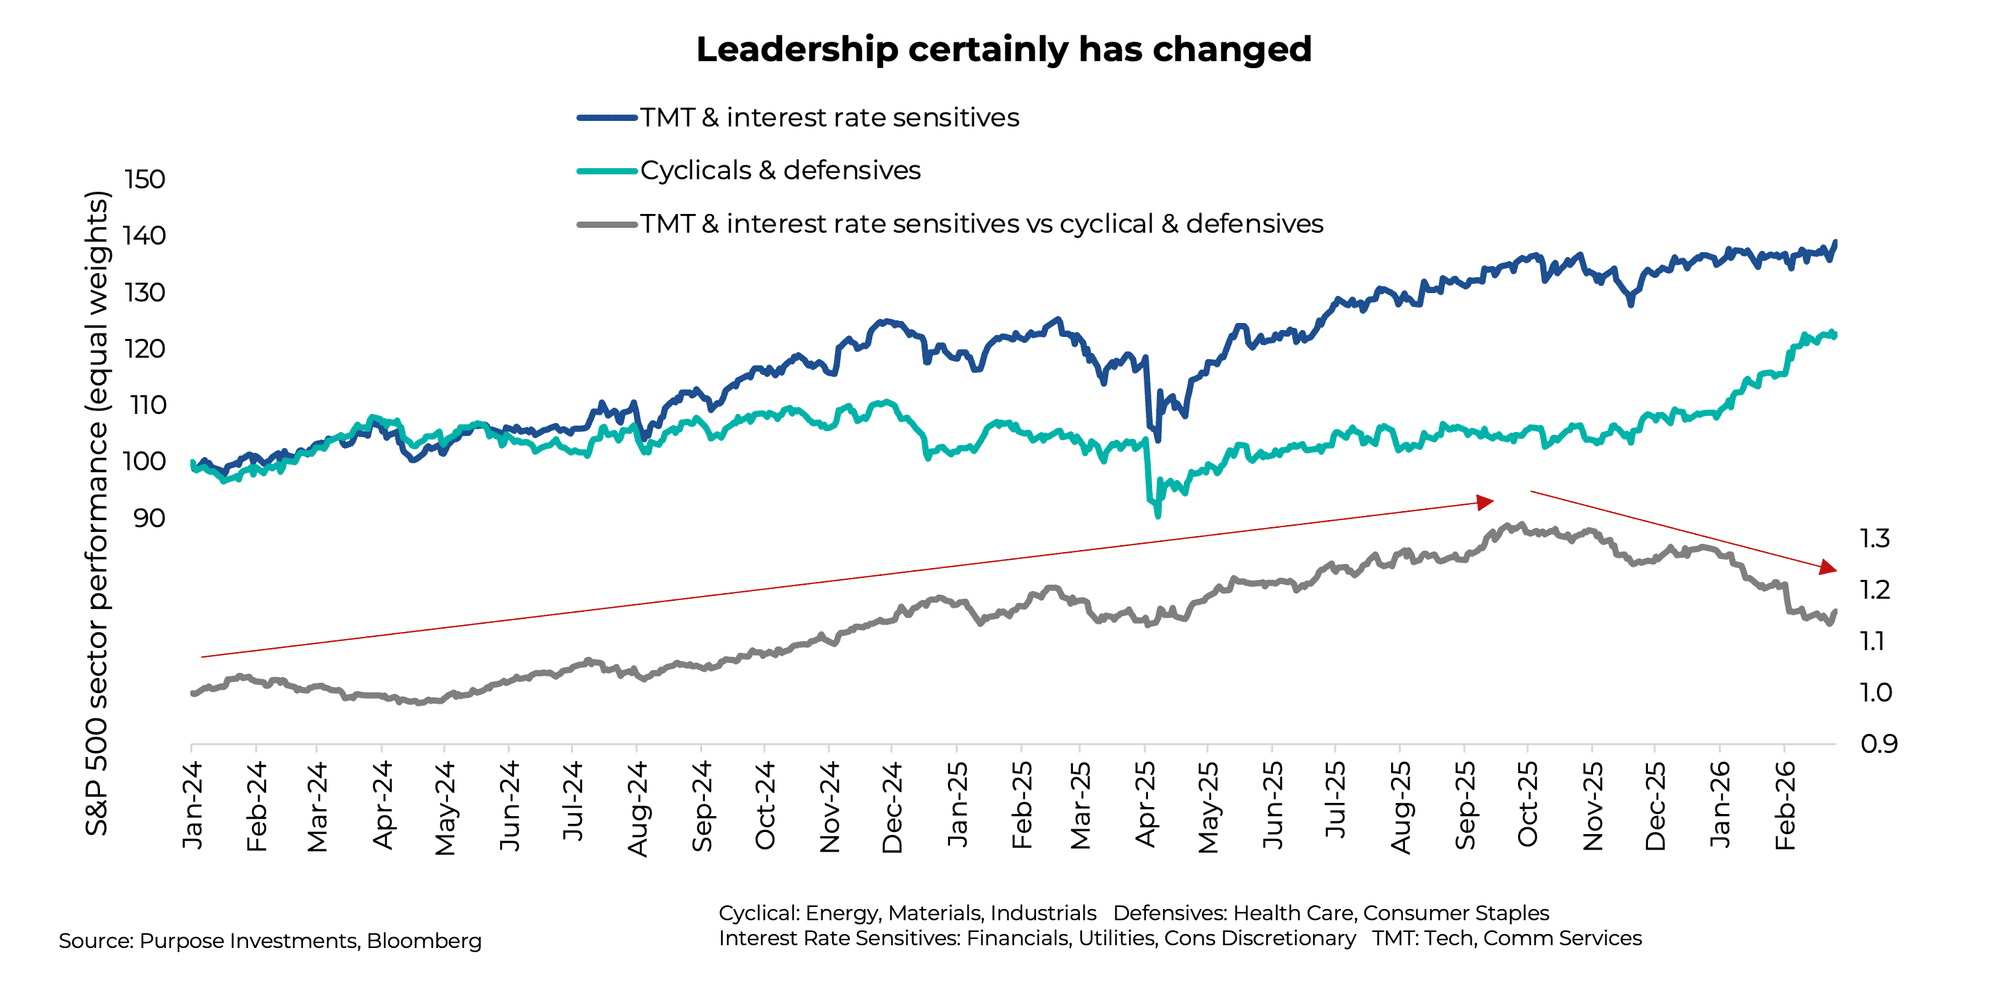
This improving economic data is not a secret; the stock market is well aware. In 2024 and most of 2025, market leadership was driven by tech, media and interest rate-sensitive sectors such as Financials and Consumer Discretionary. But since late 2025, this leadership has changed. While defensives such as Health Care and Consumer Staples are doing well, the big star is the economically cyclical sectors. These include Energy, Materials and Industrials, clearly picking up on the improving economic data and some change in leadership flows.
This improving economic data may be partially fuelled by some inventory restocking. Around the time of the tariff fiasco about a year ago, many companies stockpiled. Now with those stockpiles somewhat depleted, orders are ramping up. If this is just an inventory restocking, it could last a few quarters. If it points to broader economic improvements, it could last longer. Either way, the data is pretty darn good, and it’s helping economic cyclicals.
Japan Rising
We’re two months into 2026, and it’s been a good year so far. Sure, the U.S. is trending roughly flat so far, but Canada is up 8%, Europe is up 6%, and Japan is the star, up 17%. We’ve had a pretty heavy exposure to Japan – more than the vast majority in the multi-asset space – for some time, since June of 2022, to be specific. So we’re well aware of this strong performance, which may be lost on most investors, given that Japan is generally underowned in our opinion.
The stars have really aligned for Japan so far this year. Politics have become a positive, increasing the likelihood of more economic stimulus. But we wouldn’t get too excited; relying on politicians for market returns is rarely a good strategy. Fortunately, there are a number of longer-term or even secular factors that are providing tailwinds for Japanese equities.
They’re cheap – Not from a valuation perspective after the recent equity market advance. In Canadian dollar terms, the Nikkei is up 17% year-to-date after being up 21%, 16% and 16% in the last three calendar years. This has pushed valuations higher; they’re now up to 19x from 12x back in 2022. However, the yen remains very cheap, as just about anyone who has vacationed in Japan can attest.
There are structural reasons for the low yen, which does provide a cautionary tale for any central bank considering yield curve control. But with inflation returns and yields rising accordingly, this is a positive. And if the yen stays cheap, it would continue to provide Japanese exporters a strong competitive advantage.
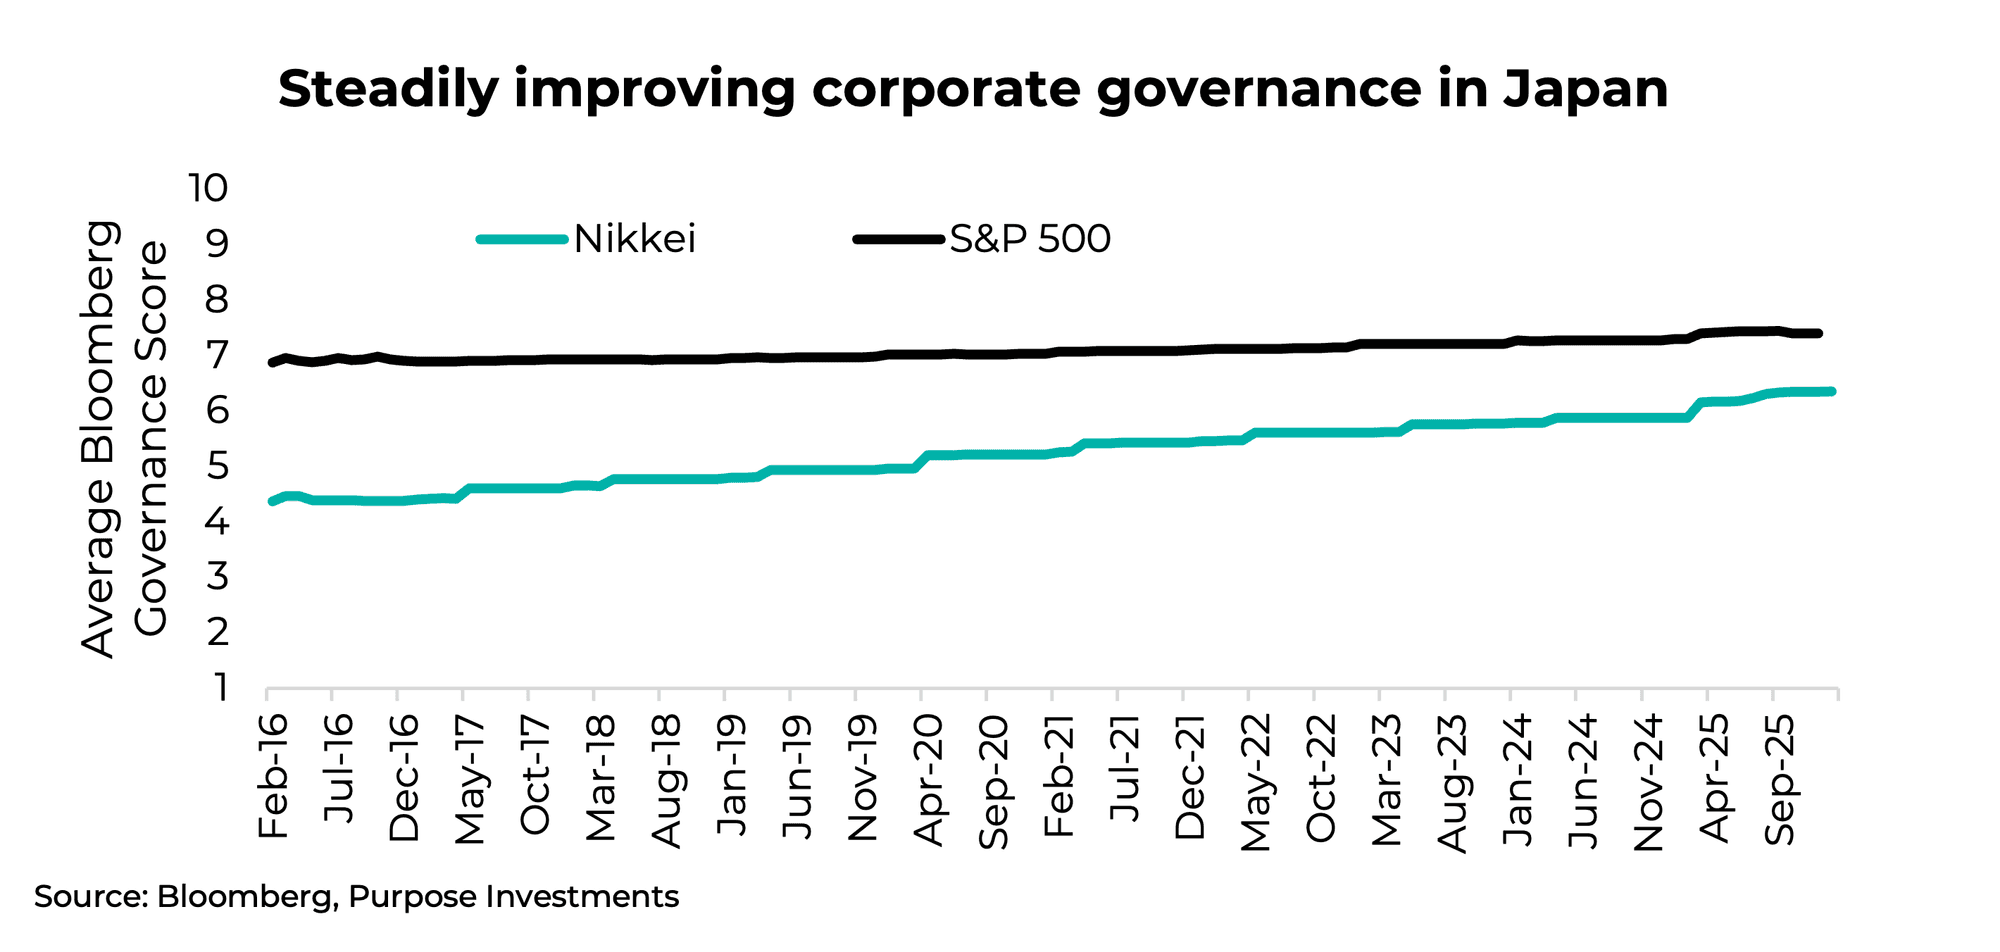
Improved governance – Corporate philosophy has been gradually changing in Japan to be more shareholder-friendly. America remains the gold standard for putting shareholders first, above other stakeholders, including employees. Generalizing here, but in previous decades, Japanese corporations put more emphasis on stability vs shareholder value. This resulted in less labour mobility, more cross-ownership, and more holding accumulated cash.
This has been gradually changing over the past few years, some from regulatory efforts, some from shareholder pressures, and some from the need to foster more economic growth. It’s challenging to measure this, but looking at the average governance score over time for Nikkei and S&P companies does capture this trend. Governance measures a number of factors believed to capture shareholder interests. The gap is getting closer.
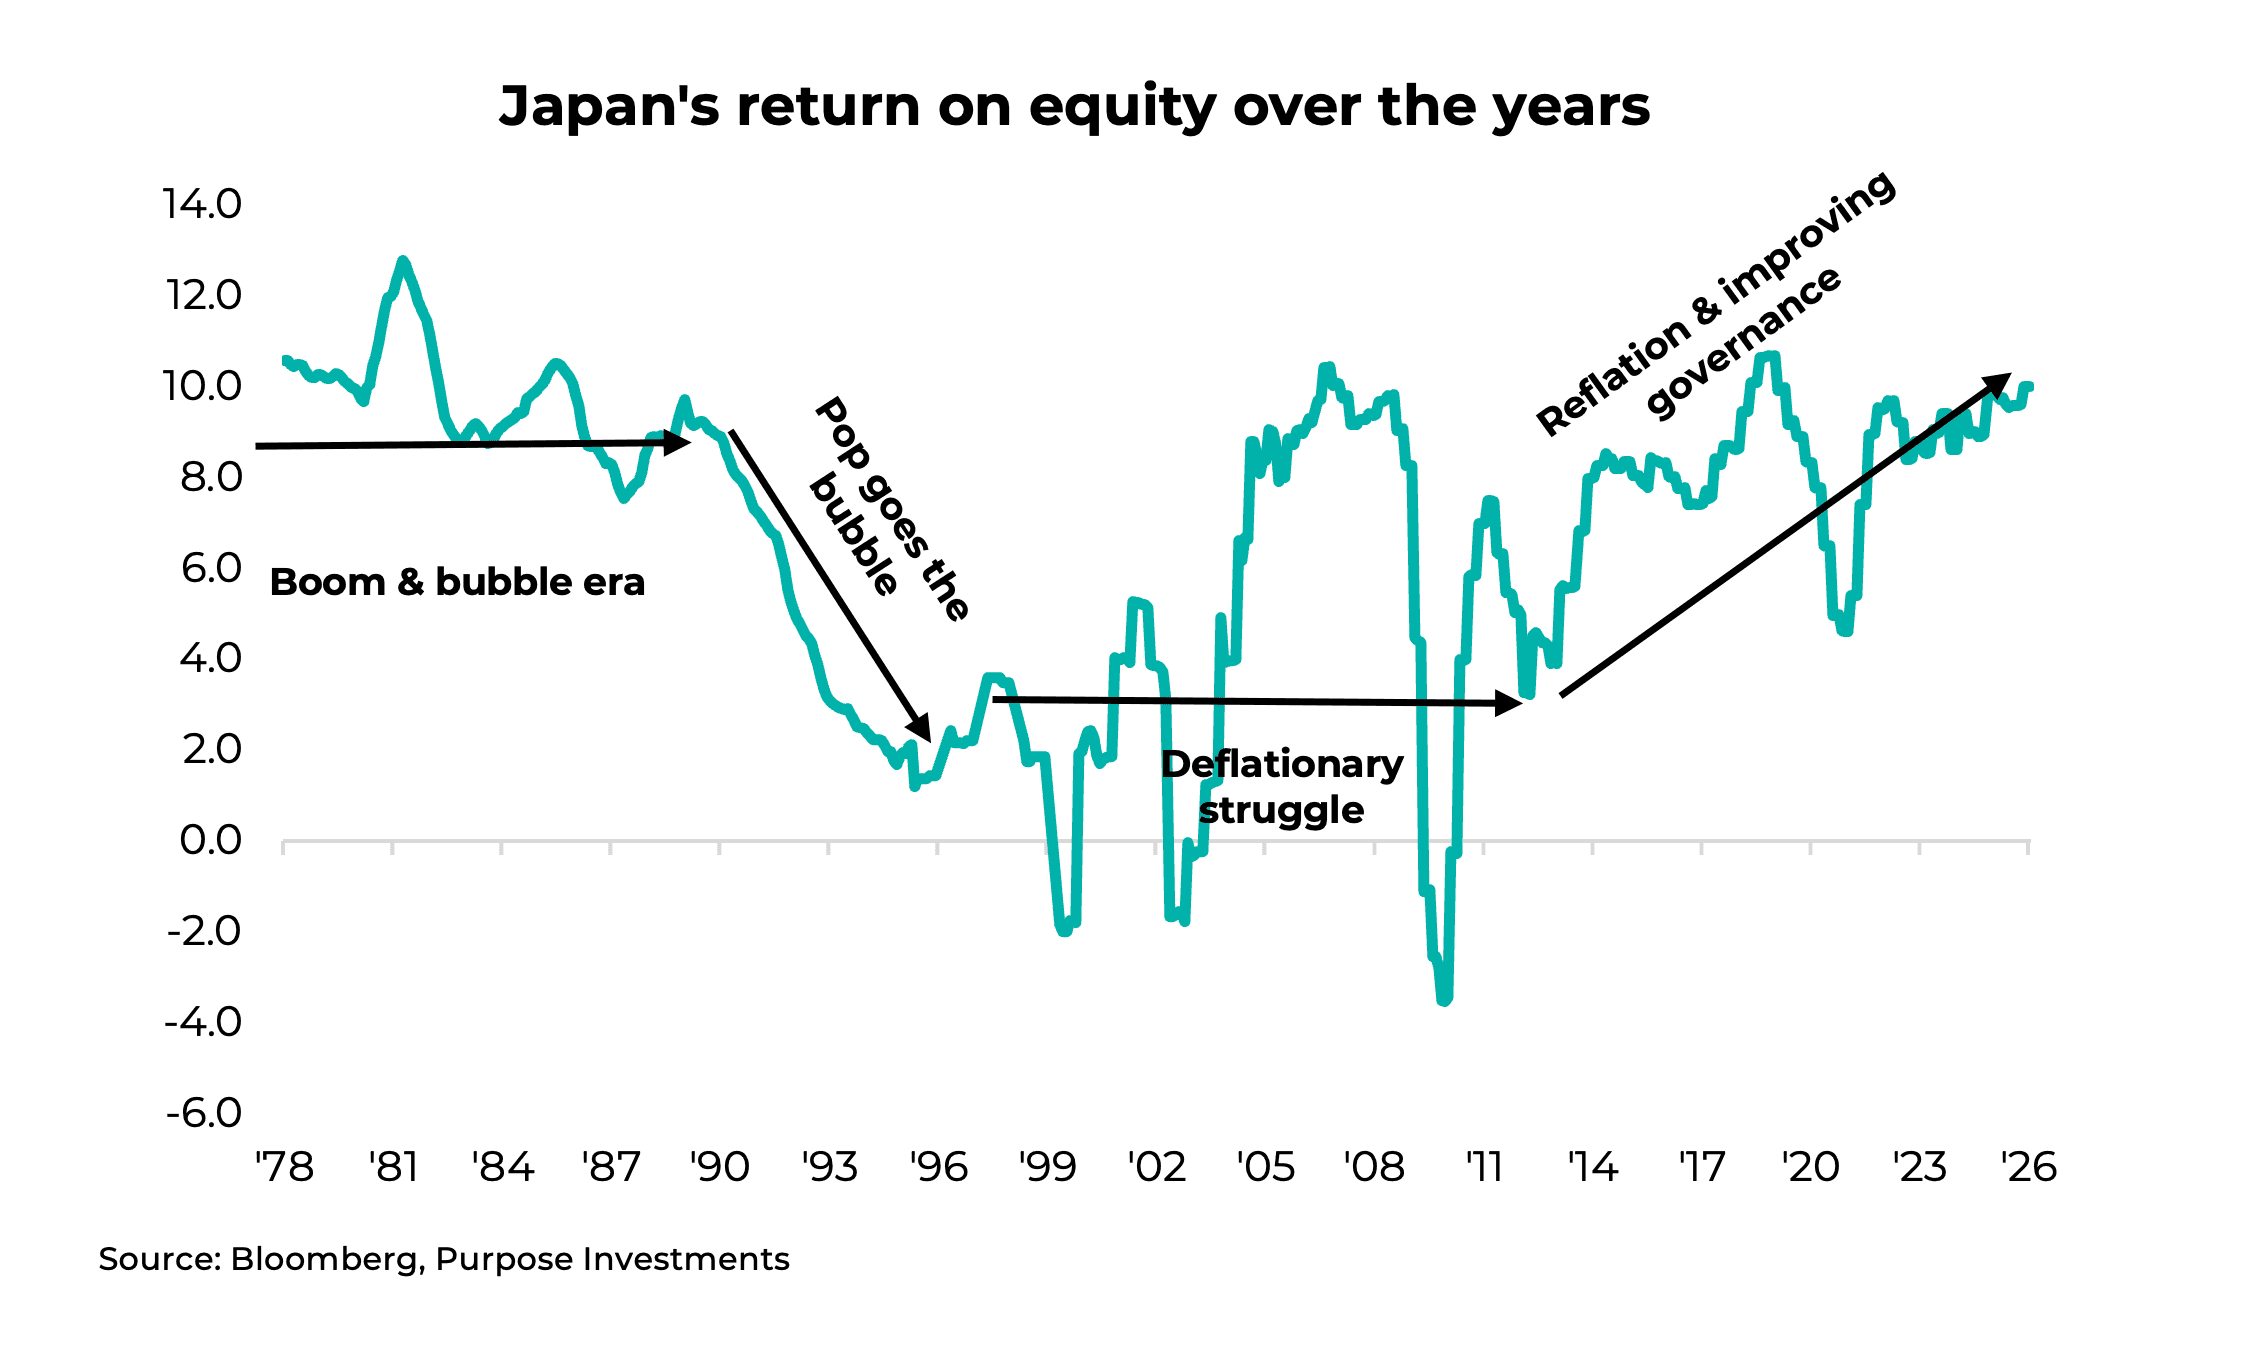
There are other factors as well. Cross ownership appears to be on the decline, and companies are returning more money to shareholders. This is a secular change and is good for markets. Below, we’ve recreated a chart measuring the return on equity for Japan since the late 1970s. This is a secular trend and may continue to provide a tailwind for equities.
We’re not saying it’s smooth sailing for Japan. We’re certainly a bit overbought in the short term. And in the longer term, there’s a very challenging demographic dynamic and just a wee bit of accumulated debt. That was sarcasm; Japan is the most indebted developed nation in the world. But these headwinds are not new, and the tailwinds continue to improve. Plus, global investors appear to be warming to Japan. We remain positive on exposure to Japan.
Market Cycle & Portfolio Positioning
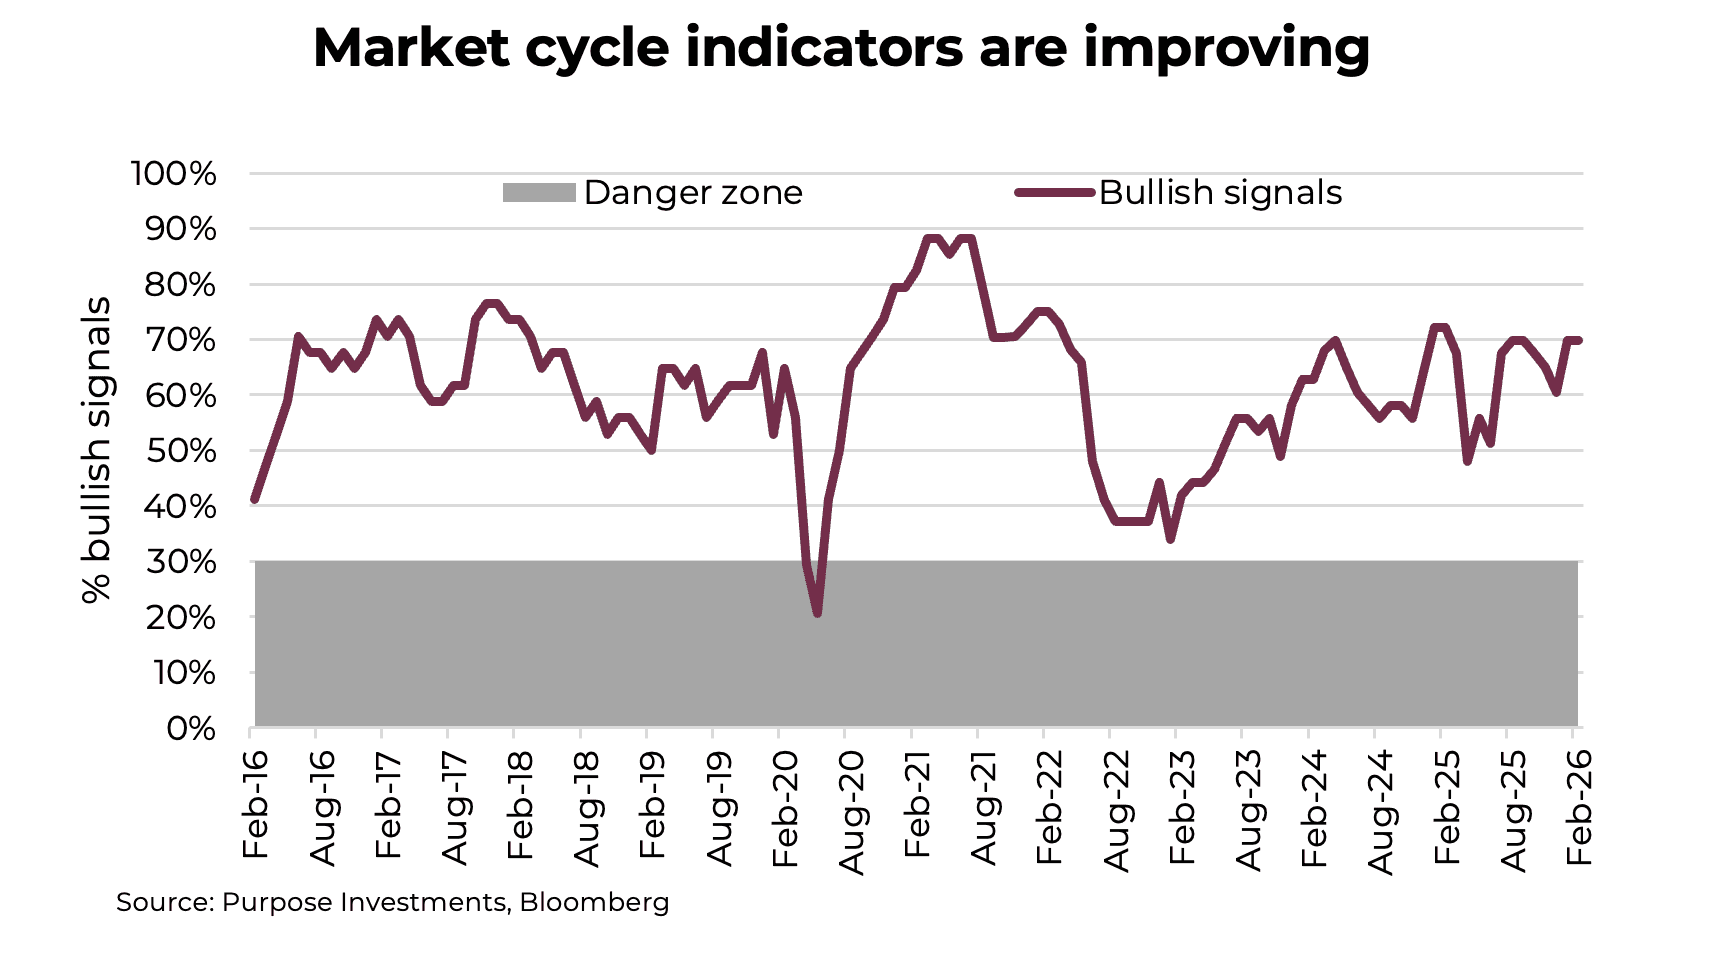
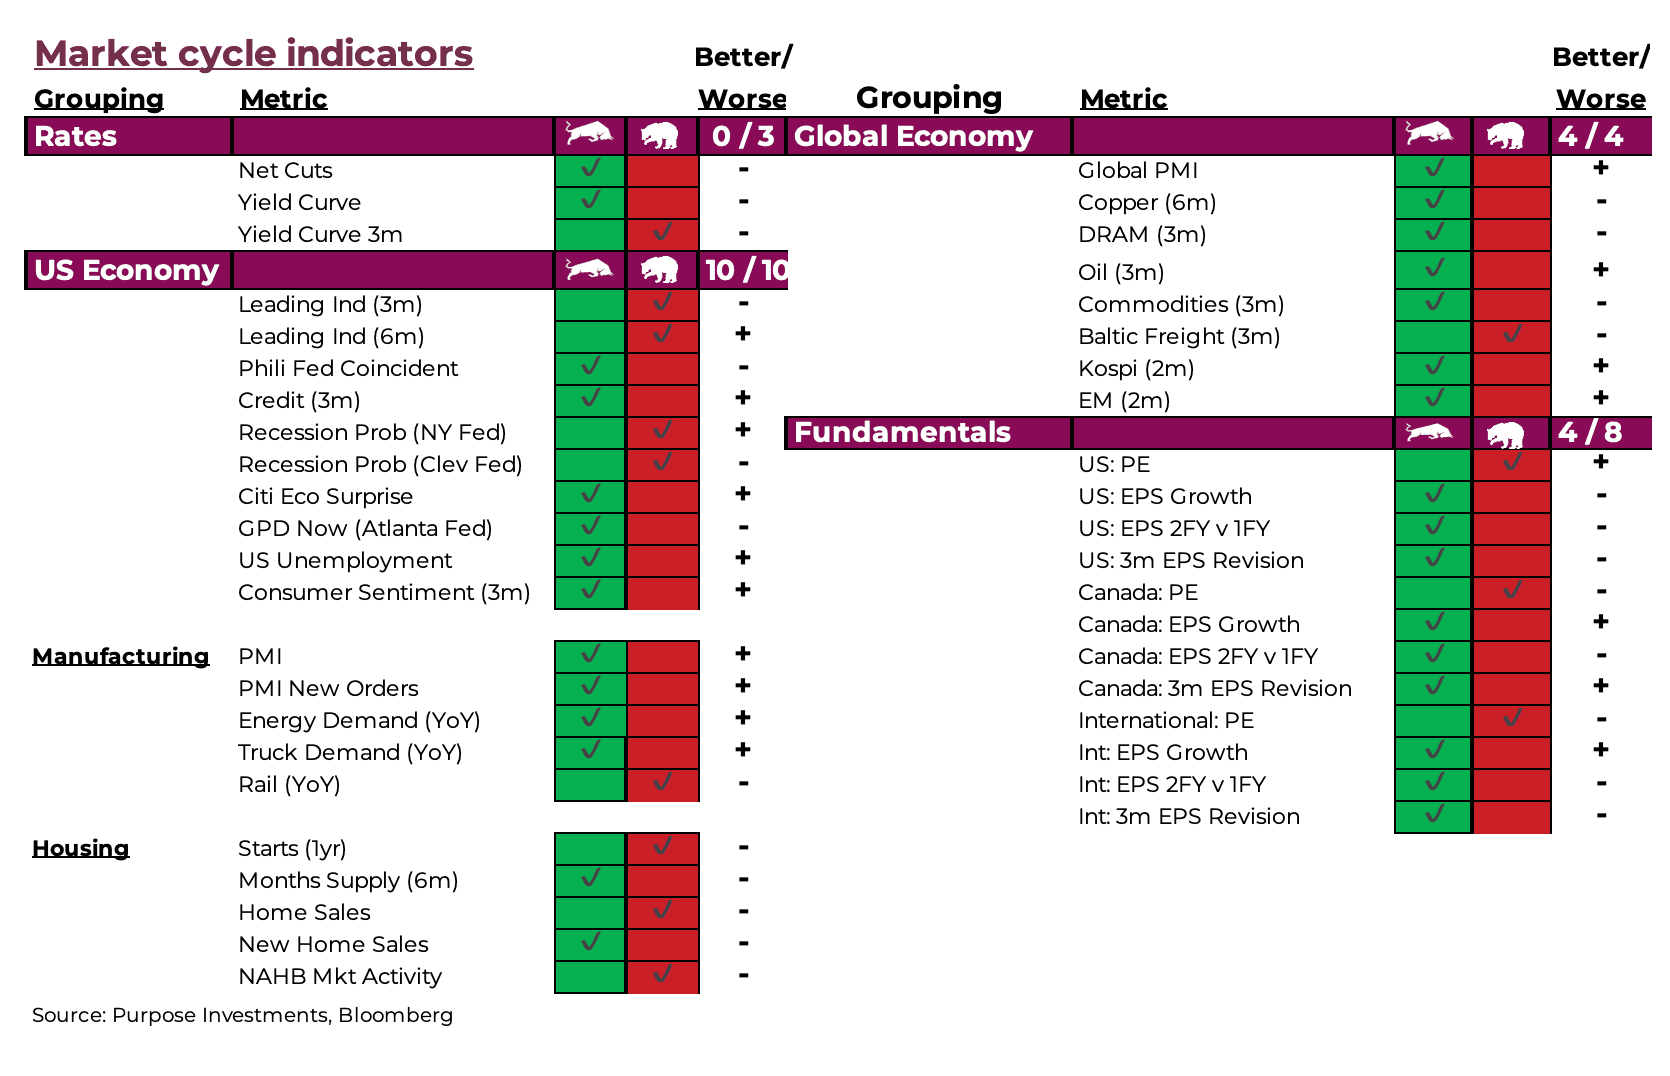
Let’s jump into it. The data was decent last month and has improved again this month. That’s probably not much of a surprise if you’ve been reading this Ethos in order. The biggest positive moves were in Manufacturing, as the PMI indicators turned bullish after last month’s encouraging survey.
This good news was offset by some softening in housing data. Housing and manufacturing are the more cyclical components of the U.S. economy, in case you were wondering why they’re carved out and given their own groupings in the table below. On the global side, there was an improvement as oil turned bullish.
Add it all up, and a healthy market cycle has become even healthier.
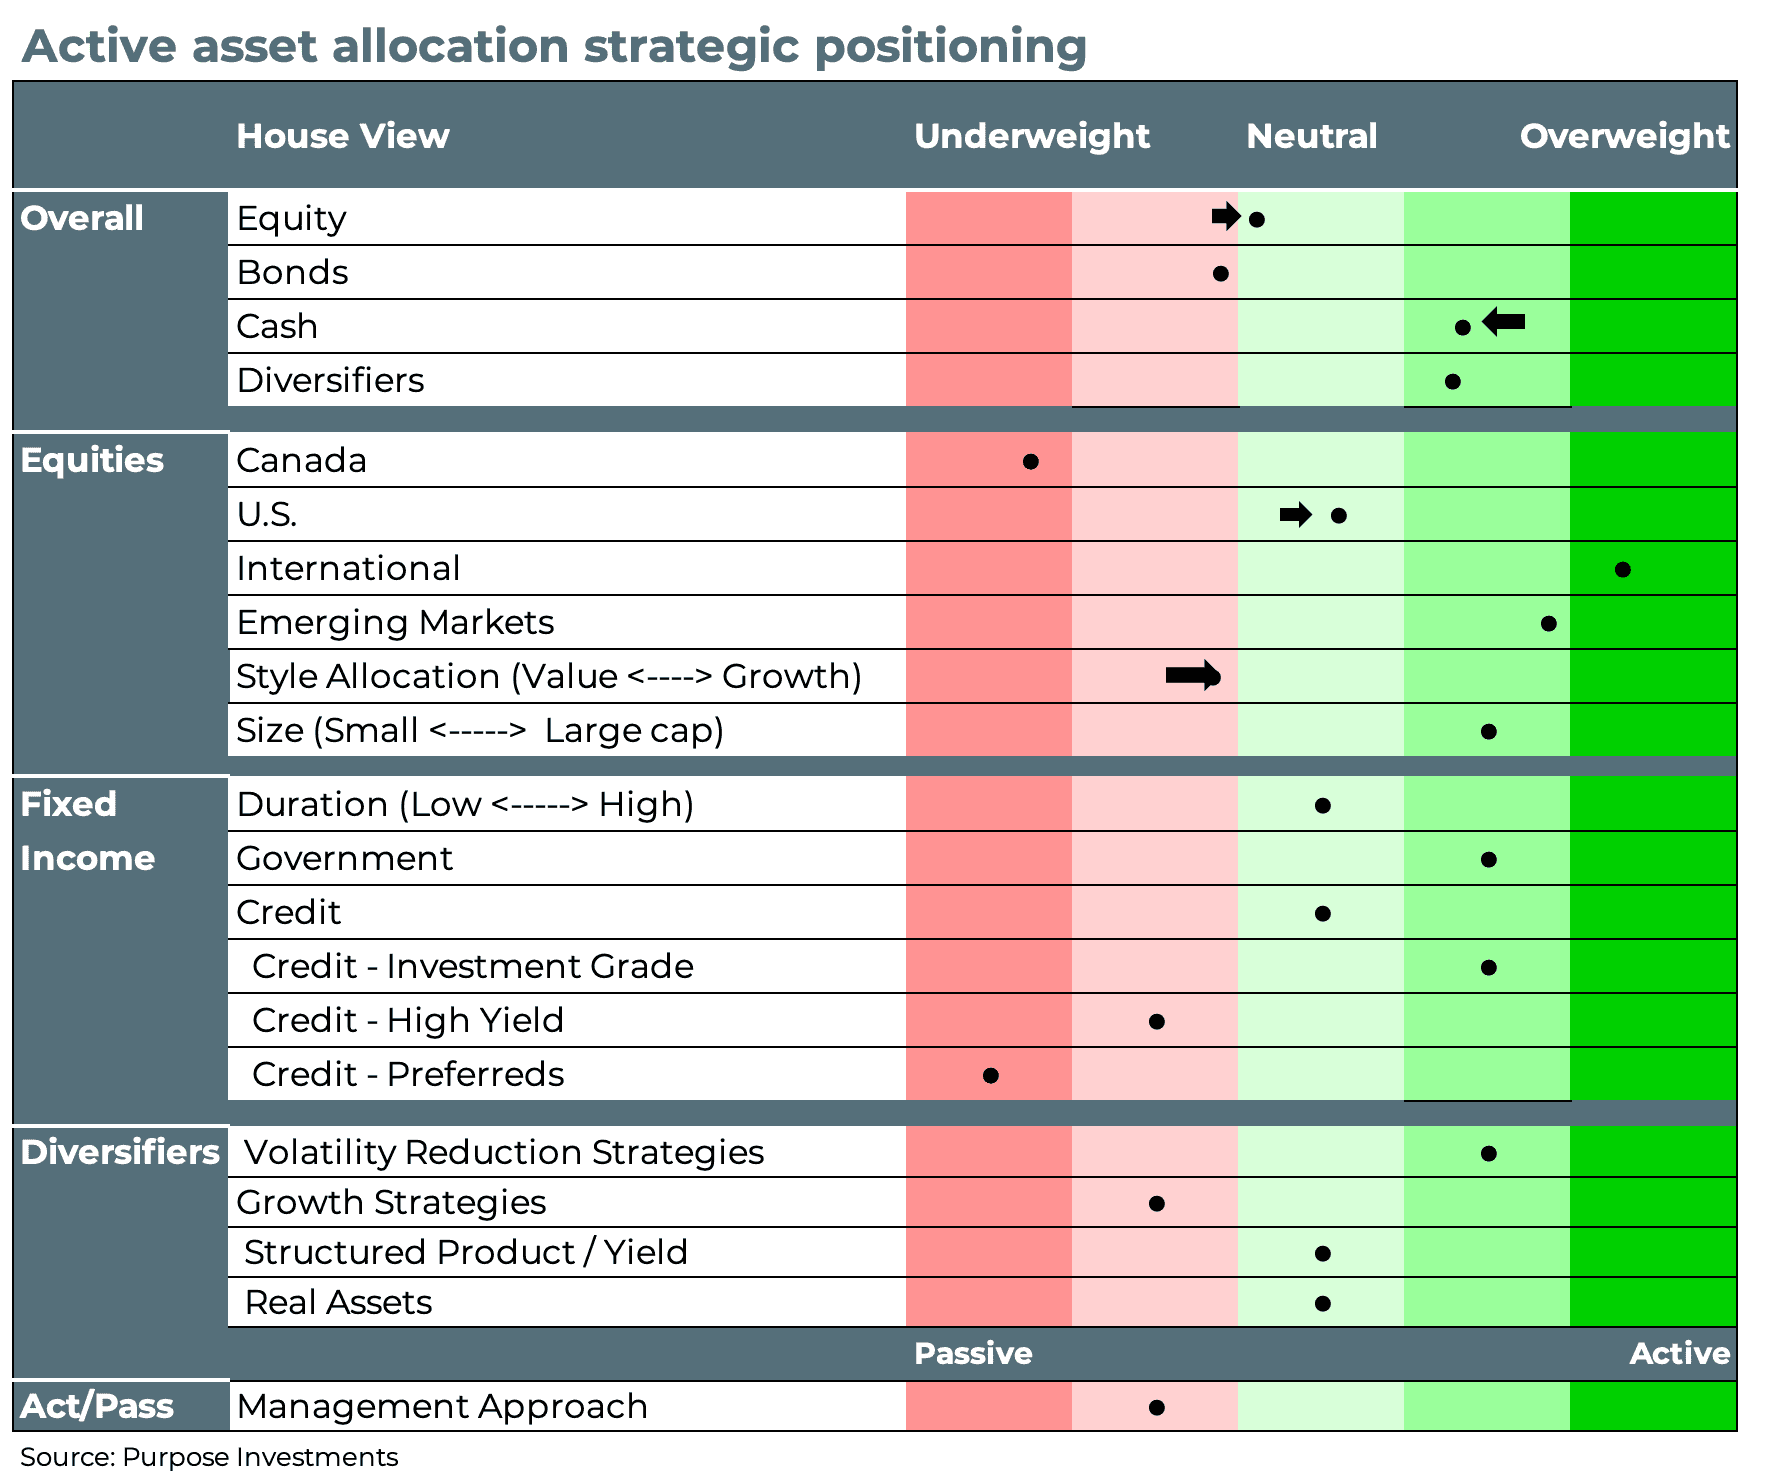
It may look like there were a few changes, but there weren’t. After the dramatic sell-off in software stocks due to AI fears, we added a small position in a software ETF. Ideally, this will be a short-term tactical trade on a market overreaction. This did tick our equity up a smidge and moderated our cash overweight a little. It also raised our U.S. equity exposure a little and tilted our style exposure to be a bit more growth.
Being more defensive, we maintained our tilt towards equal weight in the U.S., which has been working really well of late. Having more cash provides optionality. Given the healthy market cycle, we continue to view market weakness as an opportunity.
Final Note
Let’s just say it: this year is off to a great start. The dividend factor is doing well, cyclicals are helping the TSX make new highs, international is flying, the economic data is better – it’s all working out perfectly. OK, maybe not perfect, given we lost both gold medal hockey games and parts of technology kinda suck. Still, a good 2026 so far.
We do have some concerns over odd trading patterns, labour trends and credit. But there’s been more good news than bad of late.
— Craig Basinger, Derek Benedet, Brett Gustafson and Spencer Morgan
Get the latest market insights in your inbox every week.
Sources: Charts are sourced to Bloomberg L. P.
The content of this document is for informational purposes only and is not being provided in the context of an offering of any securities described herein, nor is it a recommendation or solicitation to buy, hold or sell any security. The information is not investment advice, nor is it tailored to the needs or circumstances of any investor. Information contained in this document is not, and under no circumstances is it to be construed as, an offering memorandum, prospectus, advertisement or public offering of securities. No securities commission or similar regulatory authority has reviewed this document, and any representation to the contrary is an offence. Information contained in this document is believed to be accurate and reliable; however, we cannot guarantee that it is complete or current at all times. The information provided is subject to change without notice.
Commissions, trailing commissions, management fees and expenses all may be associated with investment funds. Please read the prospectus before investing. If the securities are purchased or sold on a stock exchange, you may pay more or receive less than the current net asset value. Investment funds are not guaranteed, their values change frequently, and past performance may not be repeated. Certain statements in this document are forward-looking. Forward-looking statements (“FLS”) are statements that are predictive in nature, depend on or refer to future events or conditions, or that include words such as “may,” “will,” “should,” “could,” “expect,” “anticipate,” intend,” “plan,” “believe,” “estimate” or other similar expressions. Statements that look forward in time or include anything other than historical information are subject to risks and uncertainties, and actual results, actions or events could differ materially from those set forth in the FLS. FLS are not guarantees of future performance and are, by their nature, based on numerous assumptions. Although the FLS contained in this document are based upon what Purpose Investments and the portfolio manager believe to be reasonable assumptions, Purpose Investments and the portfolio manager cannot assure that actual results will be consistent with these FLS. The reader is cautioned to consider the FLS carefully and not to place undue reliance on the FLS. Unless required by applicable law, it is not undertaken, and specifically disclaimed, that there is any intention or obligation to update or revise FLS, whether as a result of new information, future events or otherwise.


