
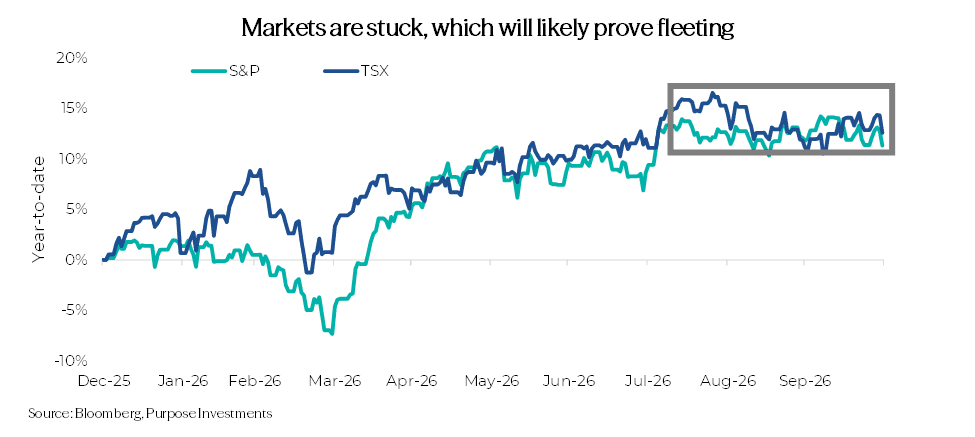
For all the headwinds and now some wobbling in AI enthusiasm, markets have been sitting in a tight range since the mid-summer rally on the back of incredible Q2 earnings (July/Aug). More on Q3 earnings shortly. Spoiler: it is not so incredible. While the chart may imply almost tranquil markets, that is certainly not the case. In that rectangular box, that is about 3-months in duration, there were a number of rotations. AI enthusiasm rose in the late summer, but higher bond yields held other parts of the market back, including gold that weighs heavily on the TSX. Then AI excitement cooled a bit and the defensives rallied hard with bond yields coming back down lifting interest rate sensitives.
We continue to believe AI exposure has become so prevalent across many equity markets and economies, as AI enthusiasm goes so go markets, and perhaps even the economy. That is not necessarily a bad thing as the spending is real and will continue given rising demand for this awesome technology. We have our doubts about the return on investment for this capex but that reckoning is likely pretty far down field. In the meantime, we will likely experience oscillating periods of enthusiasm, causing markets to oscillate as well. It has already started.
To measure the magnitude of this enthusiasm, we turn to markets as an intuitive shortcut. Based on our AI detection tool for measuring portfolio or index AI exposure, we can say with confidence the NASDAQ 100 is very heavy AI, while the S&P 500 equal weight is not. Tracking the relative performance of these two indices provides a good measure of oscillating AI enthusiasm.
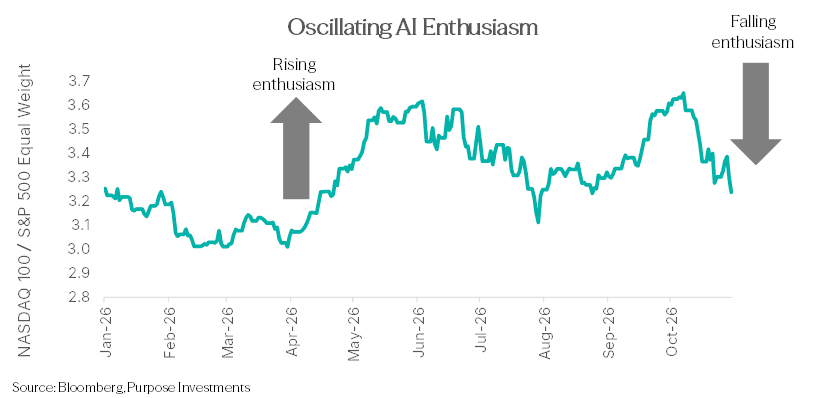
We do believe this AI bubble will persist for some time; however, we also believe we have entered into the oscillating phase that will see bigger swings in both directions. As of late, we are in a falling enthusiasm phase with a mega IPO on deck and rising concerns over returns on investment. One thing is for certain in our view, the buy and hold phase is likely behind us, that may require a more nuanced approach.
Rate of Change Calleth
The global economy is growing nicely, even with a few headwinds. Global earnings are growing too. Bond yields have even come back down a smidge, as have equity valuations. All pretty constructive characteristics, as we head into what has historically seasonally strong period for markets. Unfortunately, this market may become a victim of its own success.
On January 1, 2026, global equity earnings consensus estimates were expected to grow by 12% this year. Those estimates proved woefully too conservative. Blockbuster earnings seasons for Q1 and Q2 2026 lifted calendar year estimates to reflect a whopping 32% annual growth in earnings. 12 to 32 is a helluva revision. In fact, equity gains this year were largely accomplished during those Q1 & Q2 blockbuster earnings seasons reporting periods.
But now we are just past halfway through Q3 earnings, and it is a bit troubling. Earnings are still surprising, still growing, but the pace has certainly decelerated. For the S&P, 301 companies have reported with the magnitude of earnings beats falling to a mere 2.9%. For some context, the earnings beats were 39% and 26% in the previous two earnings seasons. Perhaps the easiest way to contrast this current earning season with the last two is in the chart below, which captures the upward revisions during earnings seasons. Q1 and Q2 earnings crushed estimates and revisions flowed. So far, this is very muted for Q3.
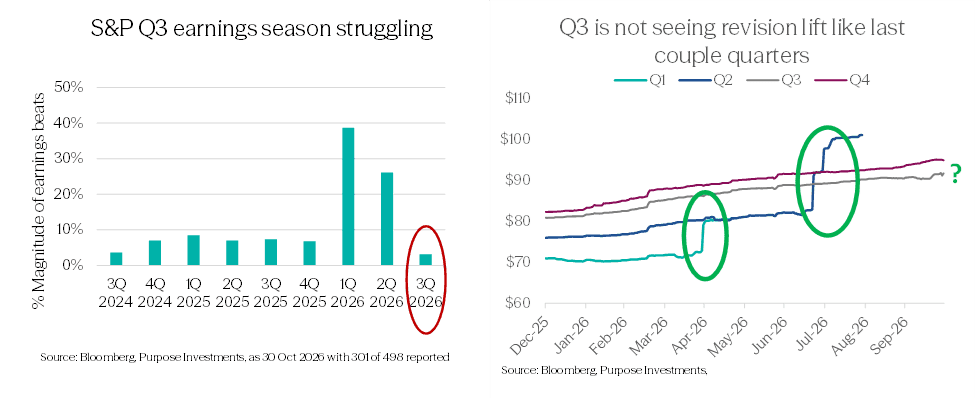
Maybe this turns around in the next week or so. Even so, it is likely the rate of change is set to slow. We may still be encouraged by the positive growth; however, markets often react more to changes in rate of change compared to absolute levels. This isn’t a surprise. Nobody expects the 30% earnings growth pace to continue. But slowing fundamentals is a challenge for markets to push higher and perhaps explain why we have been stuck in the range over the past few months.
Market Cycle
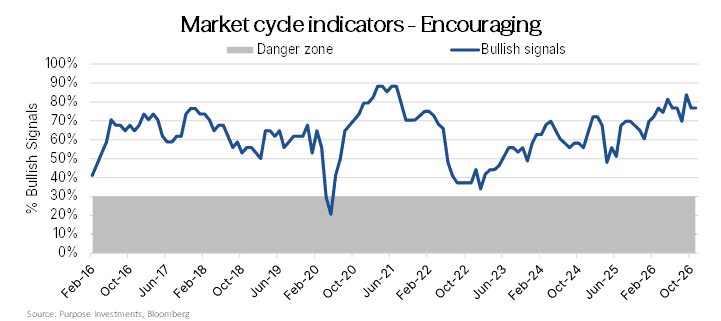
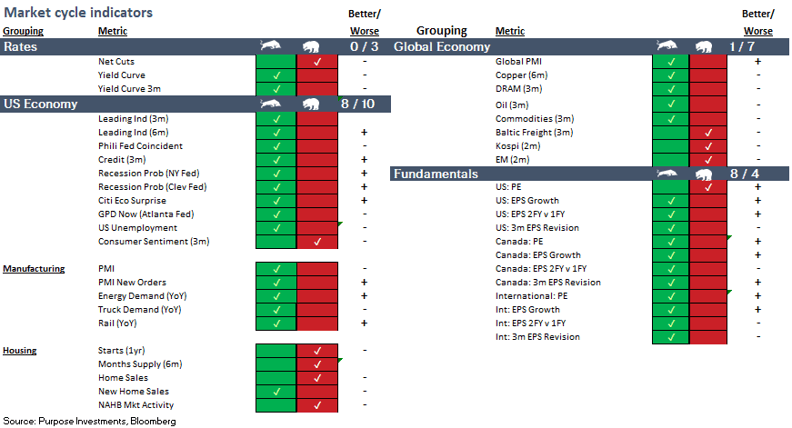
While earnings may be finding it hard to keep the pace of past success, the global economy remains in good shape. Our Market Cycle indicators largely remain in the bullish camp, with a little improvement on the U.S. side and a little softening globally. For the first time a in a long time, Leading Indicators have turned up in the U.S. Plus all indicators for manufacturing are encouraging as the global improvement in this category remains on track. The soft patch of course is housing, which is not news. Capex focused on data centers doesn’t really care that much about the level of interest rates; the housing industry still does.
Overall, still an encouraging foundation. That doesn’t rule out a corrective phase, as AI enthusiasm oscillates, so will markets. As long as the economic data holds up, weakness should be viewed as a potential opportunity.
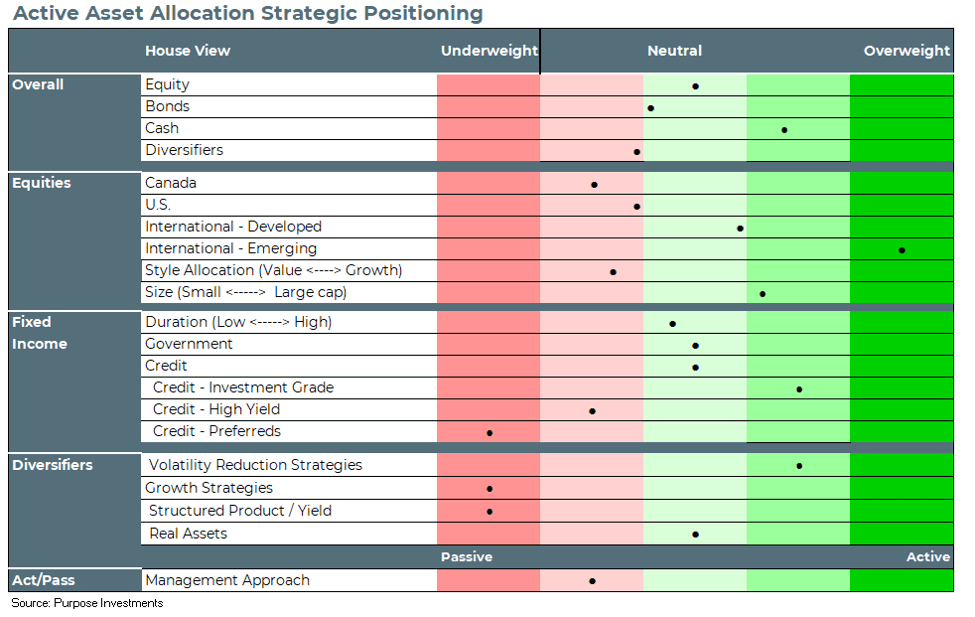
No changes to our portfolio positioning of late, the last move was to trim little and add to bonds taking advantage of that spike in yields a few weeks back. This softened our underweight to bonds, while still neutral on equities and holding more cash. Neutral to slight underweight on U.S. equities with a larger underweight in Canada. Our overweight remains focused on international developed (Asia tilt) and emerging markets.
Final Thoughts
November and December are often positive months, more often than the average. However, markets are still up a good amount this year, pricing in a lot of positive news. Who knows how the market reacts to the midterms or any change in hostilities with Iran or the pending Treasury funding announcement. All could surprise markets in either direction. But we do know the fundamental follow-through from Q3 earnings is uninspiring. This may prove to be a challenging couple of months, and we would remain defensive with an eye to be opportunistic should a correction develop. It has been a wild year already. This is likely to continue.
— Craig Basinger at Purpose Investments.
Get the latest market insights in your inbox every week.
Sources: Charts are sourced to Bloomberg L.P. as of October 30, unless specified otherwise.
The content of this document is for informational purposes only and is not being provided in the context of an offering of any securities described herein, nor is it a recommendation or solicitation to buy, hold or sell any security. The information is not investment advice, nor is it tailored to the needs or circumstances of any investor. Information contained in this document is not, and under no circumstances is it to be construed as, an offering memorandum, prospectus, advertisement or public offering of securities. No securities commission or similar regulatory authority has reviewed this document, and any representation to the contrary is an offence. Information contained in this document is believed to be accurate and reliable; however, we cannot guarantee that it is complete or current at all times. The information provided is subject to change without notice.
Commissions, trailing commissions, management fees and expenses all may be associated with investment funds. Please read the prospectus before investing. If the securities are purchased or sold on a stock exchange, you may pay more or receive less than the current net asset value. Investment funds are not guaranteed; their values change frequently, and past performance may not be repeated.
Certain statements in this document are forward-looking. Forward-looking statements (“FLS”) are statements that are predictive in nature, depend on or refer to future events or conditions, or that include words such as “may,” “will,” “should,” “could,” “expect,” “anticipate,” “intend,” “plan,” “believe,” “estimate,” or other similar expressions. Statements that look forward in time or include anything other than historical information are subject to risks and uncertainties, and actual results, actions, or events could differ materially from those set forth in the FLS. FLS are not guarantees of future performance and are, by their nature, based on numerous assumptions. Although the FLS contained in this document are based upon what Purpose Investments and the portfolio manager believe to be reasonable assumptions, Purpose Investments and the portfolio manager cannot assure that actual results will be consistent with these FLS. The reader is cautioned to consider the FLS carefully and not to place undue reliance on them. Unless required by applicable law, it is not undertaken, and is specifically disclaimed, that there is any intention or obligation to update or revise FLS, whether as a result of new information, future events, or otherwise.


