
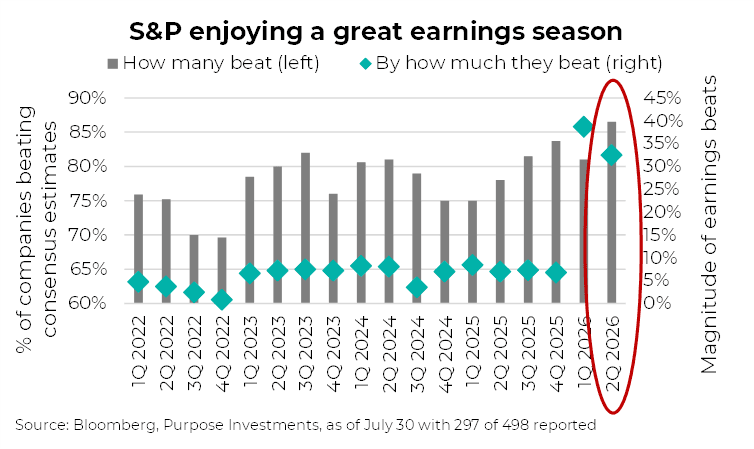
As we pass the halfway point of S&P 500 Index Q2 earnings season, summing it up so far in one word: awesome! 87% of companies have exceeded consensus analyst estimates (as of July 31, 2026). Positive surprises are the norm, but this is certainly strongly on the high side. Even more impressive, S&P 500 Q2 earnings estimates were $82 at the start of reporting season, and they have already jumped to $98, that is 46% higher than Q2 of 2025. Even better, it’s broad based as so far, every sector is enjoying positive aggregate surprises. So, it is not just energy (thanks to high oil prices) or tech (thanks to AI data center spending). It is just the right amount of inflation to help topline growth, a solid economy, AI spending and a consumer hanging in, driving these awesome results.
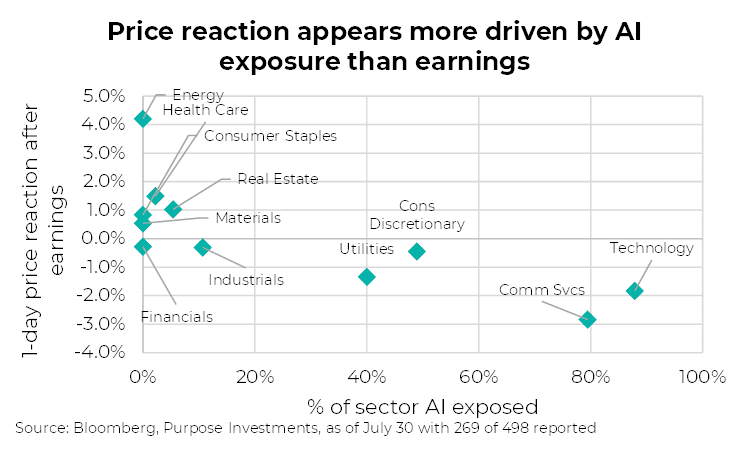
Unfortunately, share prices are not reacting as enthusiastically across the board. In fact, there is a significant divergence in price reaction. Information Technology and Communication Services are seeing sizeable earnings beats, but the share prices are moving lower on the news. Part of this reaction is likely from expectations being much higher than consensus estimates, the so called ‘whisper number’. But it is more likely driven by a cooling of enthusiasm around the AI buildout. A few quarters ago, the market might have reacted positively to news of a hyperscaler increasing capex, now not so much. Add in rising risks from China’s ‘lower cost’ AI models, the need to show a positive return on investment is building quickly at the moment. We continue to believe the market’s enthusiasm around AI will ebb and flow for many quarters, currently it is clearly flowing.
Conversely, the price reaction in other sectors is very strong. Consumer Staples, Health Care, Energy and Real Estate are seeing prices jump higher on earnings. Unfortunately, those sectors carry a combined weight in the S&P 500 of about 20%, much less than the 46% in tech and comm services. As a result, the broader market level is struggling despite the earnings season that is filled with a lot of good news.
Suppose we could celebrate this as a rotational change from growth to value, from the momentum factor to the dividend factor, or from market cap weight to equal weight. But it is none of those things, this is an AI correction. Using the Purpose AI detector (patent not pending), sectors with higher AI scores are reacting to earnings to the downside while those sectors with a lower score are doing well. The AI detector is a company-level, scaled measurement that scores whether a company is caught up in the AI theme or not.
For better or worse, this market is now driven by variances in AI enthusiasm. If this bubble has many more quarters to run, that is fantastic news. If the enthusiasm wanes, there is a lot of downside. Our stance: if you want some exposure it should be tempered. The argument we are in the early innings of share price’s reaction is weak given the amazing gains already achieved and acknowledging everyone is aware of this technology advancement. More likely we are somewhere near the 2nd hydration break. But extra time is always a possibility.
All That Glitters
When the Iran conflict broke out at the end of February, and the Strait of Hormuz effectively choked off, this was supposed to be gold's moment. Instead, since then, all that has glittered is anything but: markets are up, oil stocks surged, even the Canadian banks are up 25%. At that point, gold was already up over 20% YTD at that point and over 80% in a year. Maybe it didn’t perform exactly as expected, then again, what did we really need safety from? Whatever the market was worried about, it got over it quickly, and gold got left behind, entering a bear market down over 25%. The miners have fared even worse, with the S&P/TSX Global Gold Index down 33% as we write, just a little off the recent lows.
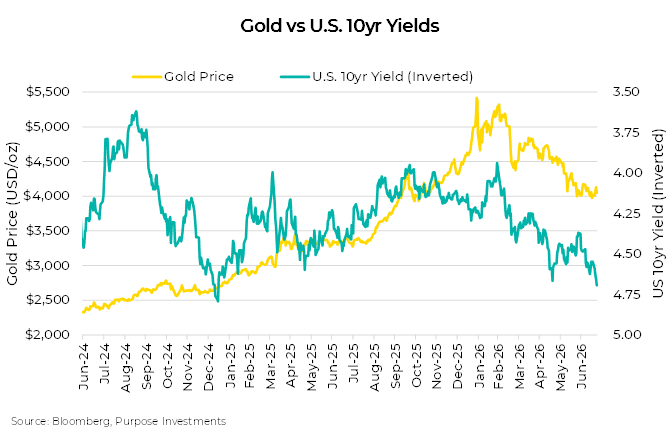
Anatomy of a golden bear - From a contrarian lens, it's an interesting setup. Call it digestion after an incredible 140%-plus return for the miners and over a 50% gain for bullion in 2025. Heck, after all that, miners are now merely performing in line with oil stocks over the past twelve months. The froth has been taken out of the market. Gold has been trading much more in line with rates recently as seen in the chart below, but the drawdown has multiple factors: rising yields, both real and nominal, a rising U.S. dollar, and a metal that was simply overbought after a sensational rally. A pullback was due but there has been little change in the fundamentals or the structural reasons behind the gold bull market of the past number of years. More recently there has been certain shift in the market. Gold hasn't made a new low since late June, carving out a potential double bottom even as yields ground higher, oil spiked again and the dollar stayed firm. Bad news that stops pushing prices down is no longer bad news. With yields nearing the range where they have typically rolled over, and bearish positioning at elevated levels, we view the risk/reward of owning the shiny yellow metal as positive once again.
One consistent buyer - Commodities trade on supply and demand, and for gold, the main character of the demand story has been central banks. That structural demand did slow last year, and cracks formed in the thesis during the outbreak of the war, as some smaller central banks were basically forced to sell gold reserves for a variety of funding reasons. A significant data revision slashed estimated first-quarter purchases from 244 tonnes to just 57 tonnes, the lowest first quarter in more than 15 years, with the central banks of Turkey, Russia and Azerbaijan leading the selloffs and several Middle East sovereign funds also selling to offset conflict-driven declines in oil and gas revenues. All told, first-half net purchases of 346 tonnes were the lowest in four years.
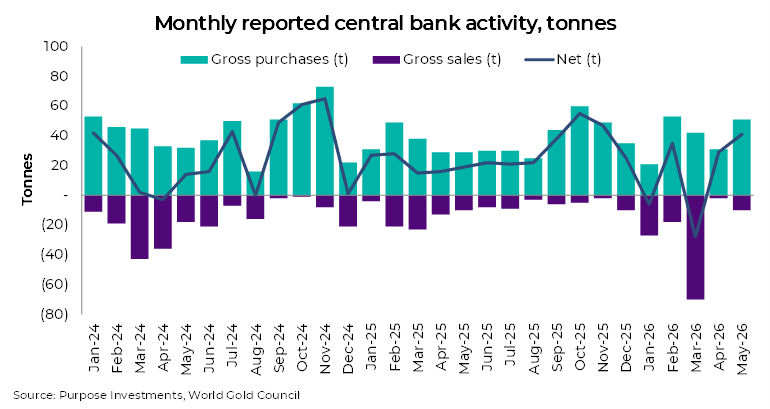
Those fears didn't survive the second quarter as central banks bought a record 289 tonnes of gold, a 74% annual increase, with the geopolitical uncertainty strengthening the case for bullion as a reserve asset. China has ramped up its buying in recent months, seeing its largest quarterly increase since 2023. From our point of view, the central pillar of the demand story remains intact. The selling pressure has abated, and central banks continue to have a strategic case to buy gold, diversifying reserves to protect against uncertainty in geopolitics and financial markets. This could help provide some support for gold prices, in our view.
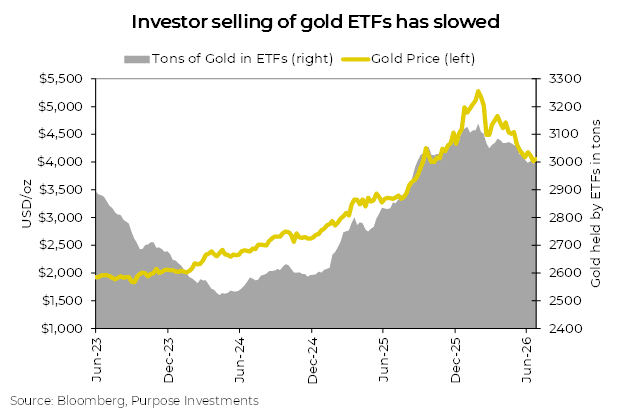
Gold in the portfolio - From a portfolio standpoint, we've long been proponents of owning at least some gold. Crisis alpha is a term we've embraced as a rationale. Gold was easy to own when it was a top-performing asset class, less so when it's been a drag over the past few months. We trimmed exposure earlier this year in our income mandates, hence the recent add back. We view it as a solid diversifier, with both inflation protection and risk-off benefits. The producers are doing well, still generating great free cash flow, growing dividends and buybacks on top of a modest but rising dividend yields for many. Judging by recent sell-side notes, inbounds from generalists have already picked up. The ETF headwind is fading too: outflows from gold-backed ETFs during the second quarter, appear to have slowed, and we've actually seen a slight uptick in tonnes held. Too soon to get excited about a slight uptick, but again, the bad news is subsiding. Within our income mandates we’ve increased our gold exposure, during the recent pullback to around $4,000oz as we believe this price level has provided a reasonable level of support for a second half rebound in gold prices.
Market Cycle
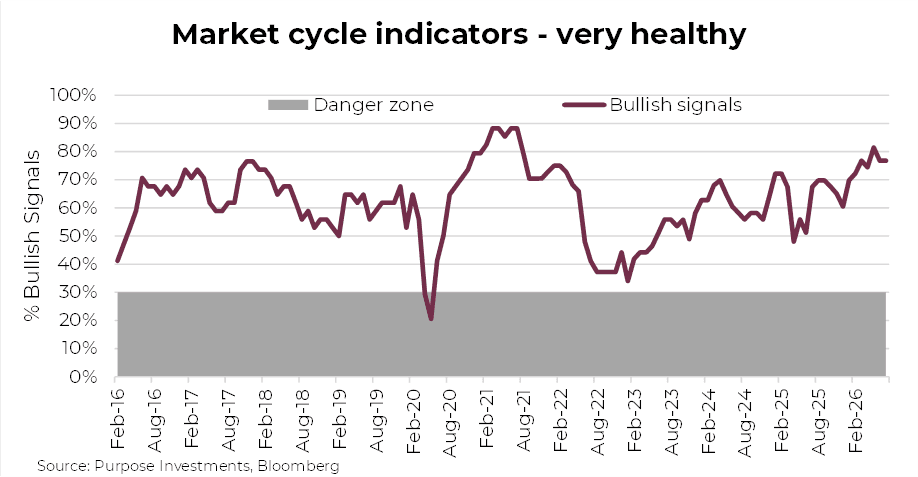
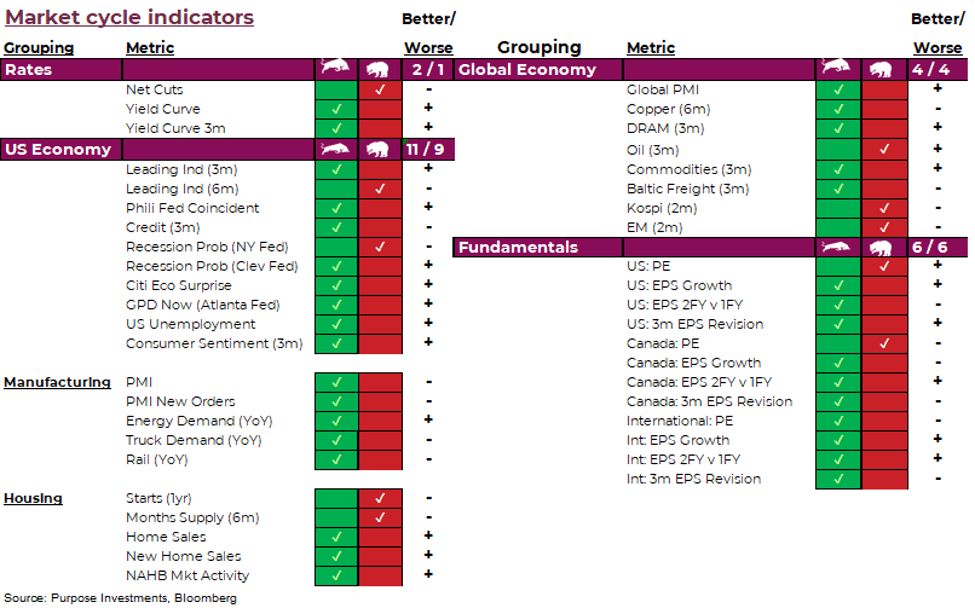
While the equity markets are currently more influenced by variances in AI enthusiasm, the foundation is solid. Market cycle indicators remain very healthy. Yield curve steepness is positive. The U.S. economic data is good. Leading indicators still bearish longer term but may be starting to turn up a bit. Surprise rates, GDP Now, employment and even sentiment appears to be stabilizing, albeit at low levels.
In future editions, we will be adding a specific section on the U.S. consumer, which constitutes 15-20% of the global economy. A number of indicators are good leaders of consumer spending, which drives the U.S. economy. Our work has seven U.S. consumer indicators: S&P 500 performance, Leading Indicators 1-year change, Bank Lending Standards, Sentiment survey, Jobless Claims, Home Prices and Oil Prices. A bit of a concern, only three of the seven are bullish including S&P 500, Jobless Claims and Home Prices. Lending Standards are only mildly bearish. A month ago, four were bullish, so there has been some deterioration.
Q2 2026 U.S. GDP showed some strong consumer spending, but so far in Q3, we have seen card data pointing to softening spending. For now, we are not concerned, and the market clearly doesn’t care either. But if the card spending continues to soften and/or more indicators flip from bullish to bearish, our concern will grow. Very data dependent, so stay tuned.
Global Economy indicators are still decent given two bearish signals are the KOSPI and emerging markets performance, currently tied up in the AI theme. More fundamental data remains healthy.
Overall, we have a slightly defensive stance. Encouraged by economic and earnings data, we have a defensive tilt mainly due to the market already pricing in a lot of good news and our opinion this is a late cycle stage.
Final Thoughts
Markets have been slightly rangebound over the past couple months, but with daily volatility heightened. AI correction is weighing on markets, but good economic and earnings data is supportive. Maybe the pullback in AI is over with Microsoft’s earnings, which resulted in a one day jump in its market capitalization by +$450 billion. We read this is a record for one day value creation. Normally we fact check such things, but it would take too long, and it sounds plausible. Once again, more characteristics of late cycle and bubble behaviour.
It is encouraging that during this AI checkback, markets held in. If the AI concerns fade, we could see a good leg higher. But given we think this is the 2nd hydration break (promise, last soccer reference) and most portfolios are up nicely, this doesn’t feel like a good time to press (that is the last one).
— Craig Basinger & Derek Benedet at Purpose Investments.
Get the latest market insights in your inbox every week.
Sources: Charts are sourced to Bloomberg L.P. as of July 30, 2026.
The content of this document is for informational purposes only and is not being provided in the context of an offering of any securities described herein, nor is it a recommendation or solicitation to buy, hold or sell any security. The information is not investment advice, nor is it tailored to the needs or circumstances of any investor. Information contained in this document is not, and under no circumstances is it to be construed as, an offering memorandum, prospectus, advertisement or public offering of securities. No securities commission or similar regulatory authority has reviewed this document, and any representation to the contrary is an offence. Information contained in this document is believed to be accurate and reliable; however, we cannot guarantee that it is complete or current at all times. The information provided is subject to change without notice.
Commissions, trailing commissions, management fees and expenses all may be associated with investment funds. Please read the prospectus before investing. If the securities are purchased or sold on a stock exchange, you may pay more or receive less than the current net asset value. Investment funds are not guaranteed; their values change frequently, and past performance may not be repeated.
Certain statements in this document are forward-looking. Forward-looking statements (“FLS”) are statements that are predictive in nature, depend on or refer to future events or conditions, or that include words such as “may,” “will,” “should,” “could,” “expect,” “anticipate,” “intend,” “plan,” “believe,” “estimate,” or other similar expressions. Statements that look forward in time or include anything other than historical information are subject to risks and uncertainties, and actual results, actions, or events could differ materially from those set forth in the FLS. FLS are not guarantees of future performance and are, by their nature, based on numerous assumptions. Although the FLS contained in this document are based upon what Purpose Investments and the portfolio manager believe to be reasonable assumptions, Purpose Investments and the portfolio manager cannot assure that actual results will be consistent with these FLS. The reader is cautioned to consider the FLS carefully and not to place undue reliance on them. Unless required by applicable law, it is not undertaken, and is specifically disclaimed, that there is any intention or obligation to update or revise FLS, whether as a result of new information, future events, or otherwise.


