White Paper on Structural Change in Government and Corporate Bond Markets
Executive Summary
The purpose of this paper is not to argue against fixed income. It is to argue that many of the assumptions embedded in traditional benchmark-oriented bond portfolios were shaped by an extraordinary forty-year period of falling interest rates, expanding central-bank balance sheets and abundant price-insensitive demand for government debt. That period has also defined the careers of most experienced investors and portfolio managers, making many of those assumptions appear permanent when they were, in fact, products of a unique market regime.
That regime has changed. Fixed-income markets have entered a new structural environment. Fiscal deficits have become persistent rather than recession-driven, government and investment-grade corporate borrowing continue to expand, and AI-related investment is adding another source of bond supply. At the same time, the price-insensitive buyers that supported markets during the QE era have largely stepped away, leaving long-term yields increasingly determined by private capital.
The consequences are already evident. The Canadian universe of bonds produced negative returns in 20211 and traditional bond funds declined another 11–13% in 2022, the same year equity markets also fell sharply2. Rather than cushioning portfolios, bonds failed to provide the diversification investors had long expected. Over the past five years, most traditional Canadian bond funds have delivered little cumulative real return despite exposing investors to meaningful duration (interest rate) risk.3
This new environment also exposes a structural weakness in traditional bond benchmarks. Bond indices allocate capital according to the amount of debt outstanding rather than issuer quality, valuation or expected return. Managers whose portfolios remain closely anchored to those benchmarks inherit their duration, their concentration in government debt and their increasing exposure to the largest borrowers precisely as debt issuance accelerates.
None of this argues against owning fixed income. Higher yields have restored meaningful income to the asset class, and bonds continue to play a vital role in diversified portfolios. It does suggest, however, that investors can no longer assume traditional benchmark-oriented strategies will automatically deliver the combination of income, capital preservation and diversification they provided during the QE era.
The central question is not whether investors should own fixed income. It is whether the benchmarks that shaped fixed-income investing over the past forty years remain the right foundation for allocation to the market today.
The Supply Demand Deluge Is Underappreciated
The defining change in today's bond market is not just that issuance has increased, it is that issuance has surged just as the market's largest price-insensitive buyers have stepped away. We believe this structural shift is likely to keep yields higher than investors became accustomed to during the Quantitative Easing (QE) era, creating a persistent headwind for traditional benchmark-oriented fixed-income portfolios.
During the QE era, expanding government deficits and corporate borrowing were readily absorbed by central banks and foreign reserve managers, allowing bond supply to grow without requiring materially higher long-term yields. Today, private investors once again determine the yields required to absorb new issuance.
The scale of new borrowing from here is substantial. From 2010 through 2016, annual U.S. Treasury deficits plus investment-grade corporate issuance averaged approximately $2.0–2.5 trillion. By 2025, that figure had risen to roughly $3.5–4.0 trillion.
To put that in perspective, the entire U.S. Treasury market is approximately $29 trillion4, while the U.S. corporate bond market totals roughly $12 trillion5. Against that backdrop, the incremental annual supply is significant relative to the existing size of these markets.
JPMorgan forecasts for corporate bond issuance combined with Congressional Budget Office deficit projection point to annual issuance exceeding $5 trillion by 2030 (Figure 1).6,7
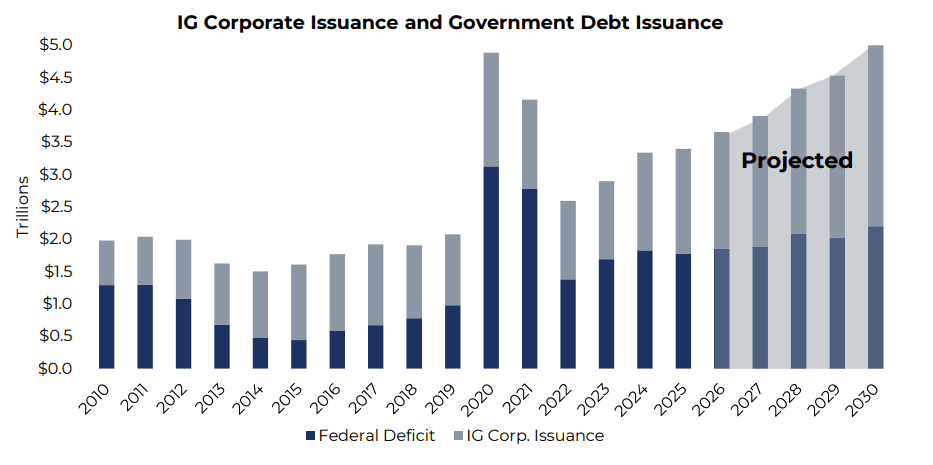
Figure 1. U.S. Government and Corporate Annual Borrowing Has Nearly Doubled Since the Mid-2010s ($ Trillions)
Source: JPMorgan, Congressional Budget Office.
AI is adding a new source of bond supply
Artificial intelligence is creating a significant new source of investment-grade bond supply. Morgan Stanley estimates global data-center capital spending will approach $3 trillion between 2025 and 2028, with roughly half requiring external financing.8 JPMorgan estimates this could generate approximately $1.5 trillion of additional investment-grade bond issuance over five years.9
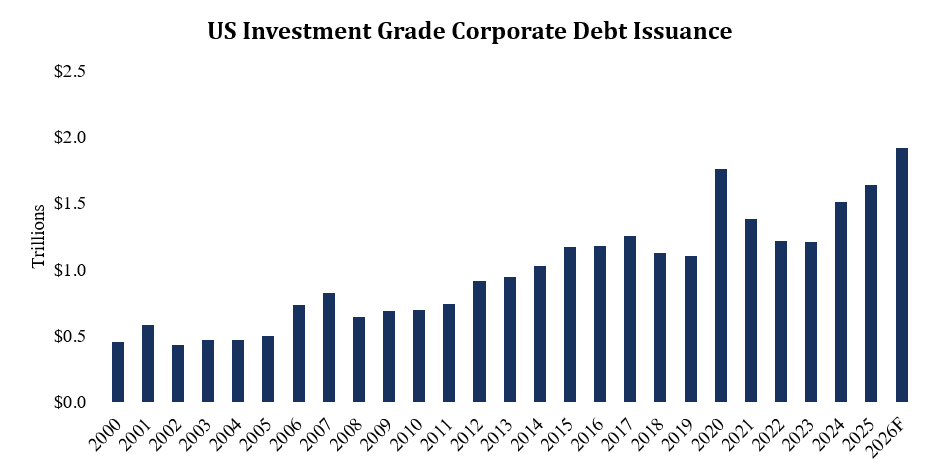
Figure 2. Investment Grade Bond Issuance 2000–2026F ($ Trillions)
Source: JPMorgan.
The trend is already evident. Amazon, Alphabet, Meta, Microsoft and Oracle issued approximately $121 billion of corporate bonds in 2025, more than four times their average annual issuance between 2020 and 2024, making AI-related issuers the largest sector of the U.S. investment-grade bond market.10
The buyer base has fundamentally changed
The challenge is not issuance alone but the disappearance of price-insensitive demand.
During the decade following the Global Financial Crisis, central banks and foreign reserve managers absorbed a significant share of new issuance regardless of valuation to keep rates low and manage the business cycle. Today, those buyers have largely stepped aside as inflation globally exceeds central bank targets so that money printing is no longer in the monetary toolkit.
The Federal Reserve is shrinking its balance sheet, foreign official institutions have become net sellers of Treasuries11, and private investors once again determine market-clearing yields.
Investment implication. For existing bondholders, higher yields reduce the market value of outstanding bonds and create a structural headwind to total returns. That challenge is amplified in investment-grade credit, where spreads remain historically tight12 and provide limited additional compensation for assuming credit risk.
Benchmark bond indices become increasingly concentrated in the largest borrowers as debt issuance grows, regardless of valuation or fundamentals. In contrast, active managers can selectively manage duration, issuer exposure and portfolio construction as market conditions evolve. As markets become increasingly driven by private capital rather than policy-driven demand, implementation becomes as important as asset allocation.
The U.S. Federal Deficit Is No Longer Cyclical
U.S. government borrowing is no longer primarily a response to recessions. Persistent structural deficits mean Treasury issuance is likely to remain elevated regardless of the economic cycle, creating a lasting source of pressure on long-term bond markets.
Historically, large fiscal deficits were related to the business cycle. Government borrowing increased during recessions to support economic activity and declined as growth recovered. That pattern has changed. Today, the United States is running deficits approaching 6% of GDP despite full employment, limited military operations and an economy operating near its long-term potential.
The Congressional Budget Office (a non-partisan agency of the U.S. Government) projects a fiscal deficit of approximately $1.85 trillion in 2026, rising above $2 trillion by 2028 and reaching $3.1 trillion by 2036. Over the next decade, deficits are expected to average 6.1% of GDP—well above the 50-year average of 3.8%, resulting in cumulative borrowing of more than $24 trillion.13
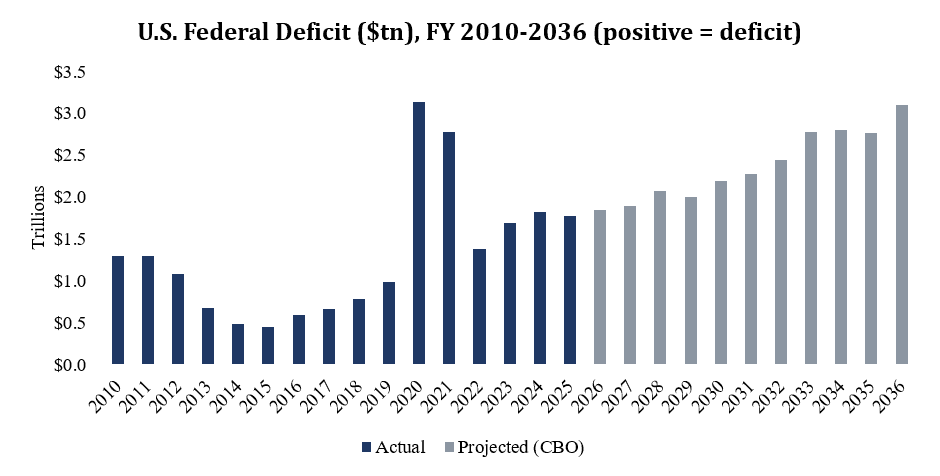
Figure 3. U.S. Federal Deficit, FY2010–2036
Source: Congressional Budget Office Projections (CBO.gov)
Interest costs are becoming self-reinforcing
Unlike previous periods of elevated borrowing, today's deficits are increasingly driven by mandatory spending and the growing cost of servicing existing debt rather than temporary fiscal stimulus.
Net interest expense reached approximately $970 billion in fiscal 2025 and is projected to exceed $1 trillion in 2026 before roughly doubling to more than $2 trillion annually by 2036.14 Interest costs now exceed national defense spending15, highlighting how debt servicing has become one of the federal government's largest expenditure categories.
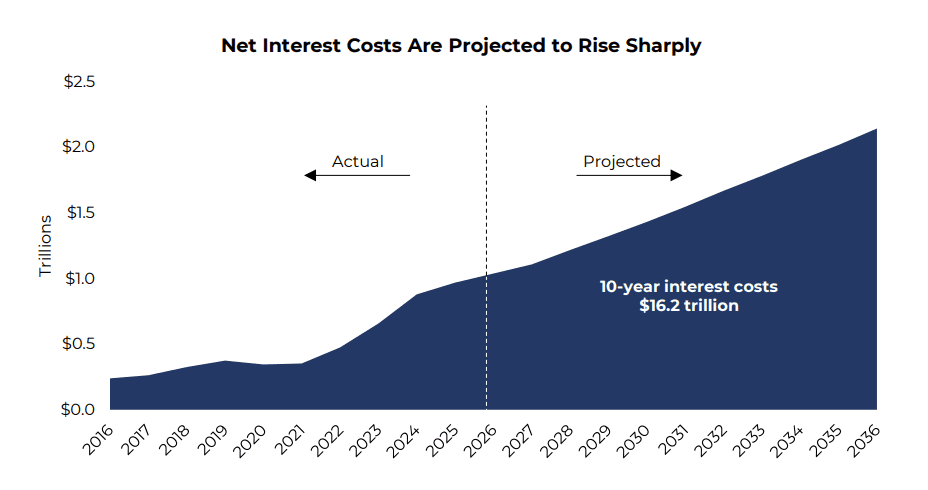
Figure 4. Net Interest Costs Are Projected to Rise Sharply
Source: Congressional Budget Office and Office of Management and Budget.
The deterioration in U.S. fiscal metrics has also prompted rating agencies to reassess sovereign credit quality. Fitch removed the United States' AAA rating in 2023, citing expected fiscal deterioration, while Moody's followed in 2025, projecting federal debt approaching 134% of GDP over the next decade.16
Investment implication. The key issue is not simply that deficits are large—it is that they have become structural rather than cyclical. With neither major political party proposing meaningful fiscal consolidation, Treasury issuance is increasingly likely to remain elevated across economic cycles rather than falling during periods of expansion.
The Shift Is Global, Not Just American
The structural forces reshaping U.S. bond markets are not unique to the United States. Across developed markets, larger fiscal deficits, higher long-term yields and changing reserve management practices point to a broader shift in how government debt is financed and priced.
By mid-2026, the U.S. 30-year Treasury yield had moved above 5% for the first time since 2007.17 Similar moves have occurred across other G7 sovereign bond markets, where long-term yields have reached decade or multi-decade highs despite declining policy rates. This divergence suggests markets are increasingly pricing fiscal expansion, persistent inflation and higher term premiums rather than simply following central bank policy.
The repricing of long-term government bonds is occurring across the developed world, not just in the United States. Governments throughout the G7 are running larger structural deficits than they did during the 2010s, while long-term bond yields have risen even as central banks have begun reducing short-term policy rates.
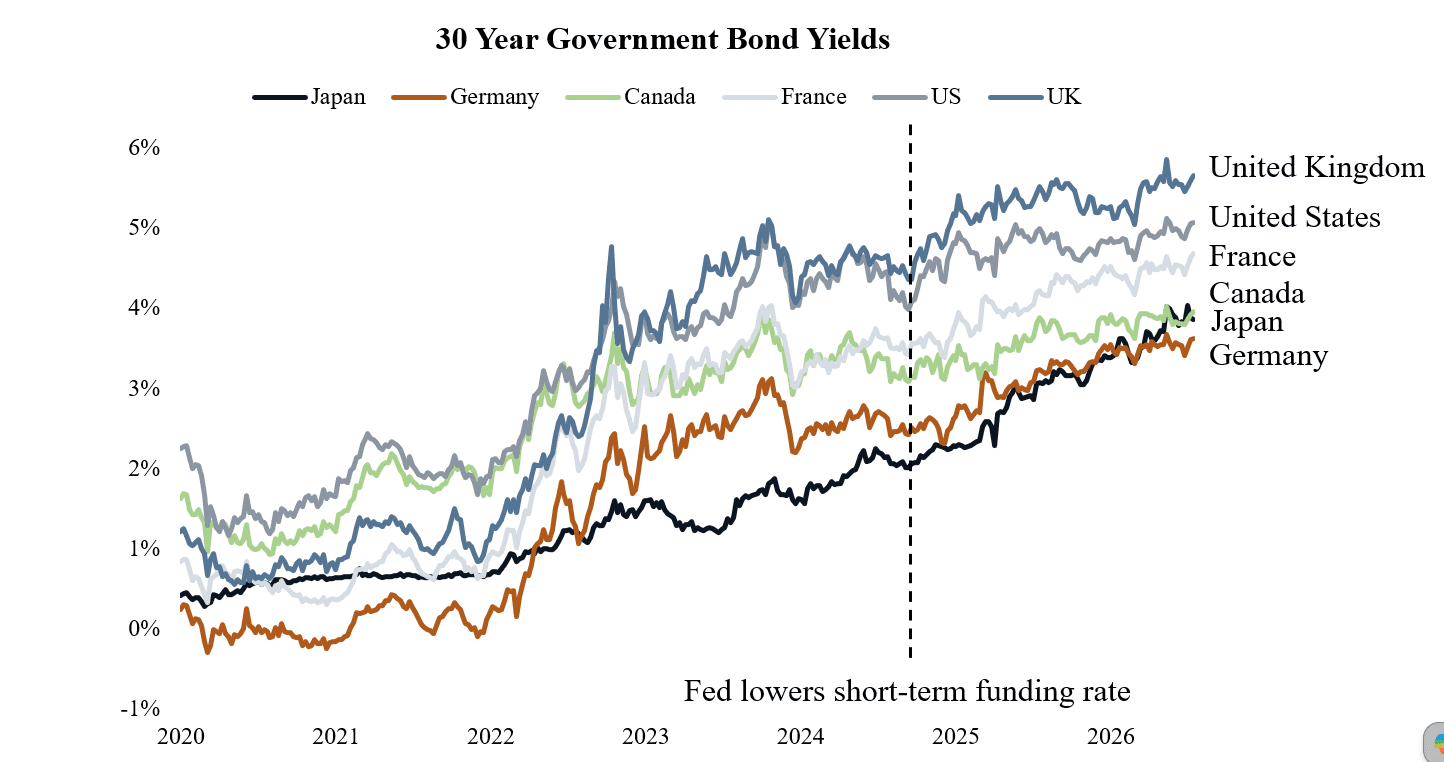
Figure 5. 30-Year Government Bond Yields Across G7 Markets
Source: Bloomberg Professional as of July 17, 2026.
Reserve managers are changing their behaviour
The composition of global reserve assets is also evolving. In 2026, gold surpassed U.S. Treasuries as the largest asset held in global central bank reserves by market value, reflecting a steady diversification of reserve portfolios over the past decade.18,19
China has reduced its Treasury holdings by roughly half from their peak20, while the freezing of Russia's foreign exchange reserves following its 2022 invasion of Ukraine reinforced concerns among some sovereign reserve managers about the geopolitical risks associated with holding foreign government assets. Together, these developments have contributed to a gradual decline in official demand for U.S. Treasuries.
Investment implication. As official demand declines globally, government bond markets become increasingly sensitive to fiscal fundamentals. Active management becomes more valuable as long-term yields are determined by market pricing rather than policy intervention.
The 40-Year Tailwind Has Ended
For four decades, falling interest rates generated capital gains that boosted bond returns and strengthened portfolio diversification. That secular tailwind has largely run its course.
From 1981 through 2020, declining yields generated one of history's greatest bond bull markets.21 Over long periods, however, Treasury yields have broadly tracked nominal GDP growth rates. During the recent post-Global Financial Crisis, QE era, long-term yields traded well below “fair value”, with 10-year Treasuries yielding roughly 1.5%-2.5% while nominal GDP growth averaged 4–5%. Bond prices were therefore supported by an unusually low discount rate from QE rather than by long-term economic fundamentals.
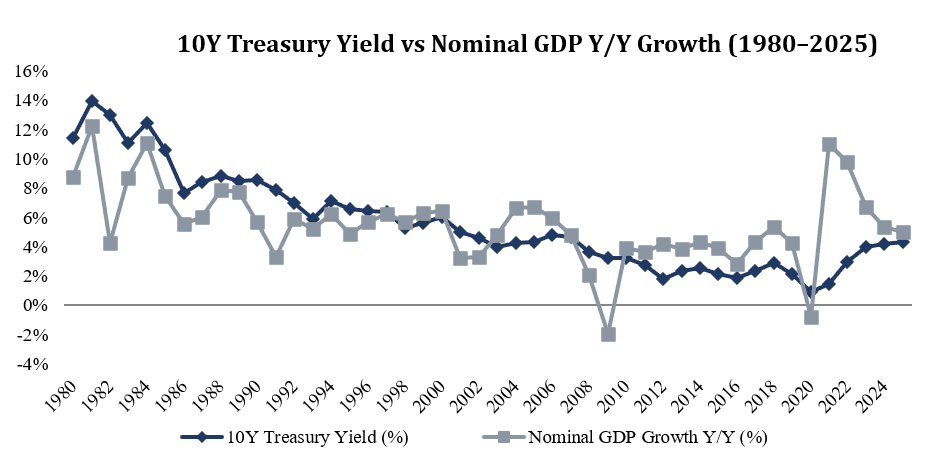
Figure 6. 10-Year Treasury Yield vs. Nominal GDP Growth, 1980–2025
Source: Bloomberg Professional; Federal Reserve Economic Data (FRED); CBO economic projections.
Today, that gap has largely closed. The 10-year Treasury yield is approximately 4.5% while nominal GDP growth is roughly 5%.22 Today's yields appear closer to long-run equilibrium than those observed during QE. The anomaly was the QE era, not the current environment.
Investment application. Investors should not assume that the capital appreciation generated by four decades of declining interest rates will be repeated. We believe that going forward, fixed-income returns are likely to depend far more on coupon income, security selection and active duration management than on a persistent decline in yields.
Diversification Depends on the Inflation Regime
The diversification benefit of government bonds is not constant. It depends on the dominant macroeconomic regime. When inflation is the primary risk, stocks and bonds have historically tended to decline together.
The strongest argument for traditional government bonds was never their yield—it was their ability to offset equity losses and have lower risk during periods of market stress. That relationship failed in 2022, when the Bloomberg U.S. Aggregate Bond Index declined 13%, the S&P 500 Index fell nearly 20%, and a traditional 60/40 portfolio suffered one of its weakest years on record.23
This outcome was not unprecedented. Long-term research shows that stock-bond correlations vary with the inflation environment. Correlations were generally positive before 2000, turned negative during the low-inflation decades that followed, and became positive again as inflation re-emerged after the pandemic.24 The IMF has similarly concluded that bonds now provide less protection against equity market declines than they did during the disinflationary period.25
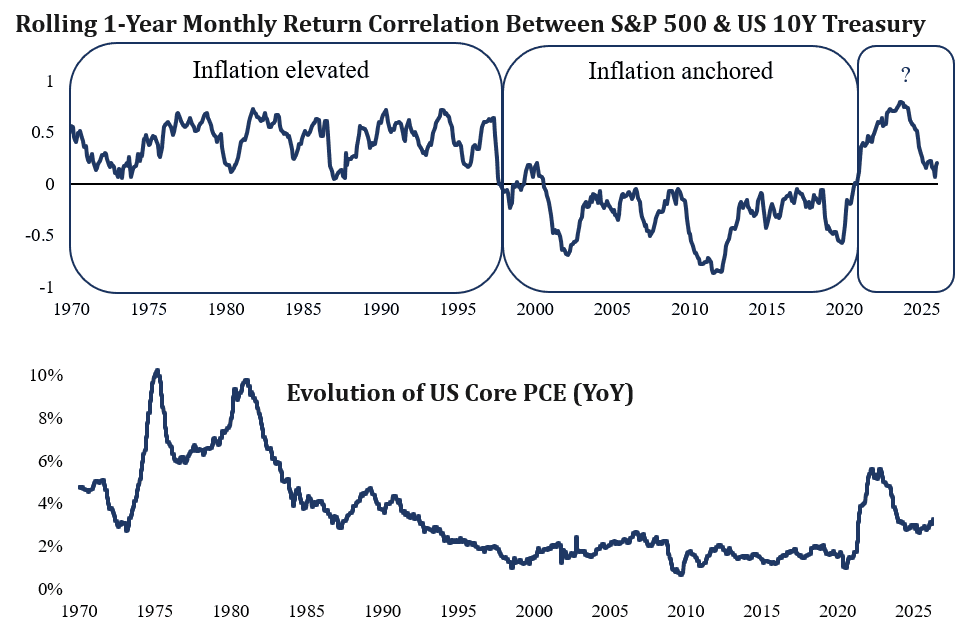
Figure 7. Stock/Bond Correlations Have Switched Signs 1980–2025
Source: Bloomberg, Neuberger calculations; as of June 30, 2026.
Investment implication. Diversification should no longer be treated as an inherent characteristic of government bonds. It is increasingly a function of the prevailing inflation regime (U.S. CPI inflation is currently 3.5%). Portfolio construction should therefore stress-test bond allocations under scenarios where stocks and bonds remain positively correlated rather than assuming the relationships observed during the QE era will persist.
When recessions are the dominant macroeconomic shock, falling interest rates typically support bond prices while equities decline. When inflation and fiscal risk dominate, higher discount rates pressure both asset classes simultaneously.
Through March 2026, Canada's largest traditional bond funds produced cumulative five-year returns of only about 3%, or roughly 0.6% annually.26 For many investors, the losses experienced in 2022 erased several years of coupon income while providing little diversification when it was needed most.
Traditional Bond Benchmarks Reward Indebtedness
Traditional bond benchmarks allocate capital according to the amount of debt outstanding rather than expected return. As debt issuance increases, investors become increasingly concentrated in the largest borrowers regardless of valuation or credit quality.
As government borrowing accelerates, index investors become increasingly concentrated in the issuers generating the greatest amount of new debt. This dynamic is not new in fixed income. High-yield bond investors have experienced it repeatedly during periods of concentrated issuance, including the telecommunications buildout of the late-1990s early 2000s25, the shale energy expansion of 2012-2014 and, more recently, AI-related infrastructure financing. As issuance accelerates in investment-grade markets, the benchmark effect is becoming increasingly important there as well.
Equity indices weight companies by market value, reflecting investors' assessment of future earnings. Bond indices use a fundamentally different approach, weighting issuers by the amount of debt outstanding. As a result, benchmark-oriented bond investors automatically lend more to the most indebted borrowers without regard to valuation, credit quality or expected return.
The Bloomberg U.S. Aggregate Bond Index illustrates the consequence. Approximately 70% of the index consists of government or government-related securities, with a duration of roughly six years.28,29 Investors who buy “the bond market” are therefore making a concentrated duration bet on the world's largest borrower precisely as government debt issuance continues to accelerate.
The logic that has made passive benchmark investing highly successful in equities translates less effectively to fixed income because the weighting methodology rewards indebtedness rather than economic success. Active fixed income managers can deliberately manage duration, avoid the most indebted issuers, and allocate capital based on valuation and issuer fundamentals—decisions that bond indices, by construction, cannot make.
Implications for Portfolio Construction
A fixed-income allocation has traditionally been expected to perform three functions: generate income, diversify equity risk and preserve capital. The preceding sections suggest these assumptions should now be challenged rather than accepted. In our view:
Income should be evaluated in real terms. Higher yields have restored meaningful income to fixed income, but future returns are likely to depend more on implementation than on declining interest rates.
Diversification depends on the inflation regime rather than being an inherent property of government bonds.
Credit selection has become more valuable. In this environment, excess return is more likely to come from security selection, duration management and credit research than from simply positioning relative to benchmark exposure. High yield bonds have inherently less interest rate risk than investment grade corporate debt and reward successful active managers disproportionately compared with investment grade corporate debt (while the inverse is true as well).
Benchmark-oriented investing implicitly accepts the market's duration, issuer concentration and exposure to the largest borrowers. Those choices should be deliberate rather than inherited.
Conclusion
The regime has changed. For four decades, benchmark-oriented fixed-income investing benefited from structural conditions that no longer exist. Today's market is characterized by higher structural borrowing, greater reliance on price-sensitive investors and less predictable diversification benefits. The issue is not whether fixed income deserves a place in portfolios. It is whether portfolios designed for yesterday's bond market remain appropriate to compound capital for tomorrow.
— Sandy Liang, CFA, Head of Fixed Income & Partner, Purpose Investment Partners
— Hilbert Wan, CFA, Associate Portfolio Manager, Purpose Investments
— Gorast Tasevski, Product Analyst, Purpose Investments
Sources
- FTSE Canada Universe Bond Index returns, Bloomberg as of December 31, 2021.
- Bloomberg – 2022 FTSE Canada Universe Bond Index, S&P 500 Index returns.
- Morningstar Direct as of May 29, 2026. Largest bond funds refer to iShares Core Canadian Bond Universe Bond Index ETF (XBB) & BMO Aggregate Bond Index ETF (ZAG).
- US Treasury Market Size: Market Value of Marketable Treasury Debt - Federal Reserve Bank of Dallas as of July 15, 2026.
- US Corporate Bond Market Size: The Federal Reserve as of March 31, 2026
- Congressional Budget Office, The Budget and Economic Outlook: 2026 to 2036, February 2026. cbo.gov/publication/61882
- JPMorgan, Alternative Investments Outlook 2026, 8th Edition: https://am.jpmorgan.com/content/dam/jpm-am-aem/global/en/insights/portfolio-insights/alternative-outlook.pdf
- Morgan Stanley Research, “Bridging a $1.5tr Data Center Financing Gaps,” July 16, 2026.
- J.P. Morgan, AI data-center financing estimates, November 2025 (approximately $1.5 trillion of investment grade bond issuance required over five years).
- BofA Global Research; M&G Investments. Amazon, Alphabet, Meta, Microsoft and Oracle issued approximately $121 billion of US corporate bonds in 2025, versus an average of roughly $28 billion per year from 2020–2024.
- SIFMA Research, US Treasury Securities Statistics, updated June 5, 2026; SIFMA Insights, Fixed Income Market Structure Compendium, 2025.
- Bloomberg, U.S. investment-grade corporate option-adjusted spreads, as of June 2026.
- Congressional Budget Office, The Budget and Economic Outlook: 2026 to 2036, February 2026. cbo.gov/publication/61882
- Congressional Budget Office, The Budget and Economic Outlook: 2026 to 2036, February 2026 (net interest of $970 billion in FY2025, crossing $1 trillion in FY2026 and rising to approximately $2.1 trillion by 2036).
- CBO historical data; U.S. House Budget Committee, “Interest Costs Surpass National Defense and Medicare Spending.” Net interest first exceeded defense outlays in FY2024 ($881B vs. $874B).
- Fitch Ratings, August 1, 2023 (AAA to AA+); Moody’s Ratings, May 16, 2025 (Aaa to Aa1). Moody’s projects federal debt of approximately 134% of GDP by 2035.
- Bloomberg Professional as at May 19, 2026.
- BofA Global Investment Strategy, BofA Global Research, World Council, IMF, Bloomberg.
- European Central Bank, The International Role of the Euro, June 2025; BofA Global Research; World Gold Council; IMF. Shares measured at market value.
- U.S. Treasury, Treasury International Capital (TIC) data, Table 5, October 2025. China peak holdings of roughly $1.32 trillion in November 2013.
- Bloomberg Professional; Federal Reserve Economic Data (FRED); CBO economic projections.
- Federal Reserve Economic Data (FRED), 10-Year Treasury Constant Maturity and nominal GDP; Congressional Budget Office economic projections, February 2026 (10-year yields averaging approximately 4.3% through 2036).
- Bloomberg index data. The Bloomberg US Aggregate Bond Index returned −13.01% in 2022, the worst calendar year since the index’s 1976 inception; the prior worst was −2.92% in 1994.
- Brixner, Ilmanen, Maloney, McQuinn and Pedersen, “Empirical Evidence on the Stock–Bond Correlation,” Financial Analysts Journal, 2024; State Street Global Advisors, “The Global Trend of Positive Stock/Bond Correlation,” 2024.
- International Monetary Fund, “Stock-Bond Diversification Offers Less Protection From Market Selloffs,” IMF Blog, February 18, 2026.
- Bloomberg professional. Largest bond funds refer to iShares Core Canadian Bond Universe Bond Index ETF (XBB) & BMO Aggregate Bond Index ETF (ZAG).
- Brookfield Public Securities Group, “Navigating Sector Default Risk in the High-Yield Market: Lessons From Past Sector Default Cycles.”
- Bloomberg Professional, as of May 31, 2026.
- Bloomberg US Aggregate Bond Index factsheet data, Q3 2025. Treasuries approximately 46%, agency MBS approximately 24%, investment grade corporates approximately 24%; modified duration approximately 6 years.
This document is intended for informational and educational purposes. It is not being delivered in the context of an offering of any securities, nor is it a recommendation or solicitation to buy, hold or sell any security. No securities commission or similar regulatory authority has reviewed this document. Information contained in this document is believed to be reliable but has not been independently verified. Material contained in this publication should not be considered legal, tax, investment, financial or other professional advice.
Certain statements in this document are forward-looking. Forward-looking statements (“FLS”) are statements that are predictive in nature, depend on or refer to future events or conditions, or that include words such as “may,” “will,” “should,” “could,” “expect,” “anticipate,” “intend,” “plan,” “believe,” “estimate” or other similar expressions. FLS are not guarantees of future performance and are by their nature based on numerous assumptions. Although the FLS contained in this document are based upon what Purpose Investments believes to be reasonable assumptions, Purpose Investments cannot assure that actual results will be consistent with these FLS.
Index returns referenced are historical and do not reflect fees or expenses. Past performance may not be repeated. Third-party data and research cited herein are the property of their respective owners.