
In 2022, as yields rocked higher, a recurring investor question to advisors was "how much do I have invested in bonds, and what is the duration?". Gold’s rise in 2025 elicited "how much gold do I own?". In 2026, the question has migrated to "how much AI exposure do I have in my portfolio?"
How much gold was a straightforward calculation, how much Artificial Intelligence (AI) is not? This "bubble", driven by a revolutionary technology and the race to build the infrastructure to deliver, is no longer just a hyperscale, semiconductor or memory story. The demand has spread to other technology suppliers from networking gear, servers and integrators.
Beyond the technology sector this infrastructure buildout is impacting utilities, power suppliers from gas to nuclear to renewables, storage, backup power, construction, engineering, industrials, HVAC, copper demand to rare earths.
As the market impact of AI becomes pervasive, every portfolio is exposed. This elevates the question from 'how much AI?’ to ‘what kind of exposure?’ to ‘where is my AI exposure coming from?’. Those are more difficult questions to answer, and it isn't for lack of diligence. The market has quietly made AI exposure a default setting, and there's no line item on a statement that says so.
This week's Ethos is not another entry in the AI bubble-or-not-bubble debate (though we do lean towards the former). There is a compelling rationale for owning a lot of AI exposure or a little. But not knowing how exposed your portfolio is or how it is exposed, is not good. This is a framework to help answer those questions.
The AI Everywhere Challenge
If you asked anyone a year ago how much AI exposure is in emerging markets, most would likely have said very little. Whoops, there is tons from China to Korea to Taiwan. Starting closer to home, the S&P 500’s AI score based on our model is roughly ~45% in AI-related or impacted companies. AI-related is the chip supply chain: the cloud and data centres, the model builders, and software. Add in a number of other companies in non-tech sectors that are impacted, you get up to nearly half of the index. If you own the market, you have made a large, concentrated AI allocation just by being allocated to the largest equity market in the world.
But this is not just a U.S. story, though the flavour changes as you travel to different markets, not just by overall exposure but by the type of exposure.
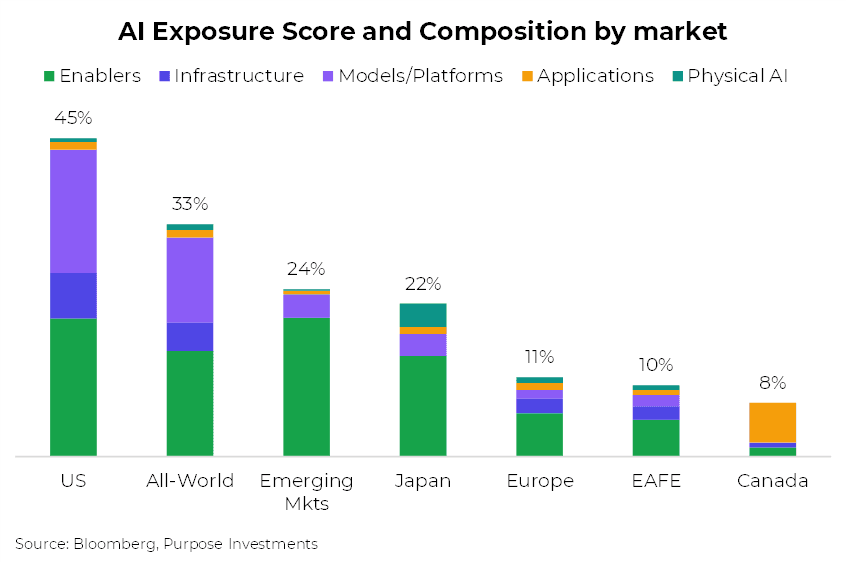
Emerging markets and Japan carry roughly a quarter of this exposure. Europe and Canada are less exposed at or below 10%. That works out to a bit under $50 trillion of the global market capitalization appears to be influenced by this changing technology, to varying degrees.
But the headline number is only half the story, because the kind of AI is completely different in each bar. U.S. domiciled AI is mainly chips and model platforms — NVIDIA, Microsoft, Alphabet. Japan's AI is mainly chips plus something the S&P barely has – robotics and automation. Canada's AI is almost entirely application software — Shopify, Constellation — with essentially zero chip or model exposure. While emerging markets are the purest picks and shovels trade on earth: foundries, memory, and packaging.
While most companies span multiple AI subsectors, we categorize each company based on the most dominant. NVIDIA is an Enabler, Infrastructure includes both software or utilities providers like Palantir or Emera, Alphabet is in Models/Platforms, Salesforce in Applications and Physical AI are robotics and other companies.
Same label, but four very different situations. A client holding Japan and a client holding the S&P/TSX both "own AI" and their exposures have almost nothing in common.
Hotdog, Not Hotdog
Here's the challenge: there is no AI sector, no GICS classification, no Morningstar category, no index with a settled definition of AI. "Technology" doesn't work — utilities building data centre power are in the trade, and plenty of technology companies are not. Is Amazon an AI company? Morningstar files it under Internet retail. Tesla? That's currently an automaker. Both share prices are clearly sensitive to AI.
Want proof the definition problem is real? Take emerging markets. A standard cap-weighted EM fund scores about 24% AI on our framework. An EM fund that excludes China — resulting in higher concentration in Taiwan and Korea — scores about 43%. Same asset class, similar line on your statement, and the AI exposure nearly doubles based on a single twist on exposure.
As our credit manager Sandy Liang quipped, this is a “hotdog, not hotdog” challenge. Or for those readers versed in machine learning vocabulary, it is a labelling issue. Is a company, or more specifically its share price, being impacted by this AI revolution?
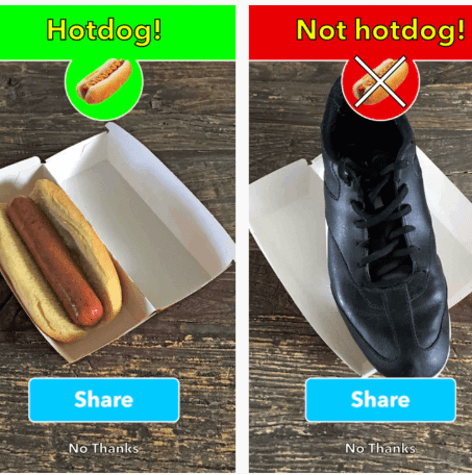
Complicating matters even more, a hotdog today may not have been a hotdog a year ago and may not be a hotdog in 2027. Cisco was not an AI sensitive company a year ago. Today it is. There is no perfect approach, and some will disagree with our framework, but it is clear, evidence based.
Our “hotdog, not hotdog” approach uses two signals:
1. The industry signal - A company counts if it operates in an AI-relevant industry — semiconductors, chip equipment, infrastructure software, and so on, in tiers. This catches the structural exposure, but it misses Amazon (internet retail) and Tesla (autos).
2. The consensus signal - A company also counts if the market's established AI-thematic ETFs already hold it. Call it the "the market has already voted" test. This catches Amazon and Tesla, but alone, it would miss smaller industry names no thematic fund bothers with.
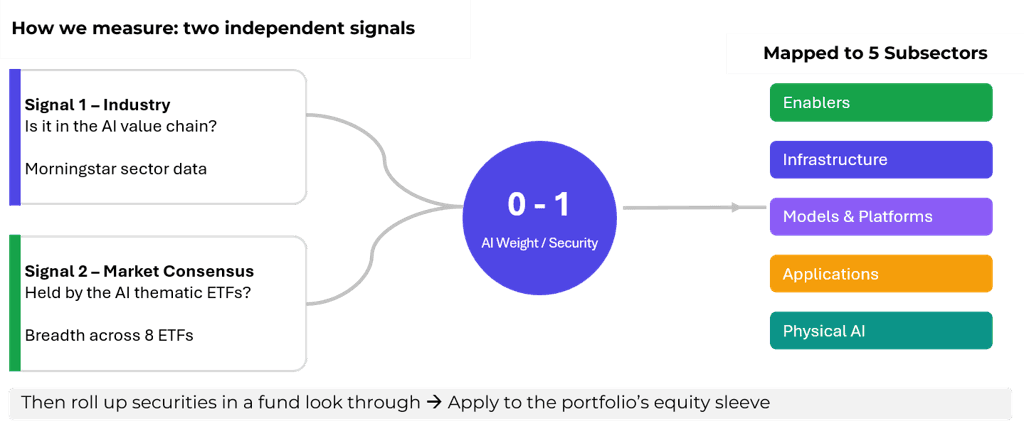
A name that fires either signal gets an AI weight. That weight is a score between 0 and 1. When both signals fire it is a 1. A market consensus only name lands between 0.6 - 1.0, scaled by how many of the eight thematic funds hold it; and 0.9, 0.8, or 0.4 for an industry only name, by how directly its business ties to AI. Funds are scored by looking through to what they actually hold, and every name lands in one of five buckets — chips & hardware, cloud & data centres, model developers, AI software, and robotics — because as the regional chart shows, what kind matters as much as how much.
One thing this deliberately is not is a measure of AI revenue. It measures how much equity sits in AI-adjacent companies in your portfolio. A different question, but the one that determines how your portfolio behaves when the trade lurches.
What This Looks Like in Practice: An Illustrative Example
We ran our own Purpose Active Balanced Fund through the framework, next to a popular passive balanced ETF.
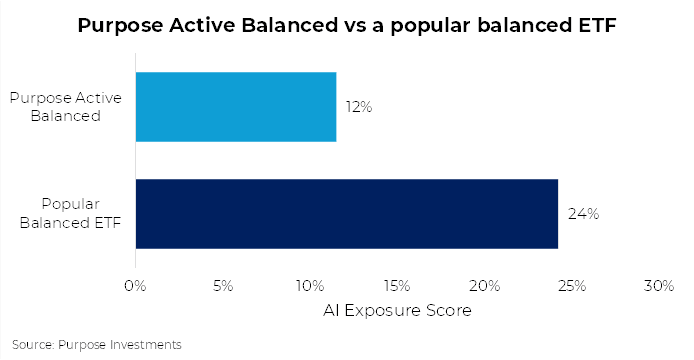
The popular balanced ETF: 24.2% of its equity is AI-related by our methodology. The standard balanced fund, that so many use is carrying a quarter of its equity in the AI trade. Nobody building this passive product chose that, the index did.
Purpose Active Balanced ETF: 11.5%, less than half of the other ETF’s exposure. And when we break that down by source, every basis point of it is index driven. It arrives through broad market holdings, not through a single deliberate AI position.
Are we surprised we’re low? Not really. Our bias tends to lean defensive — an income tilt, a value bias, a structural underweight to the mega-cap growth names that carry this trade. A defensive balanced fund should be light here. If the AI trade keeps running, that underweight is a headwind we’ll accept. However, if our hunch about this being a bubble is correct, we’d like to err on the side of caution. Some exposure but not too much.
The point however is not the underweight. It is that we can now quantify it as a number, and defend it as a choice versus discovering it down the line. Prior to us measuring, our assumption was that we are likely underweight the AI trade. This helps confirm it.
Final Thoughts
The irony is not lost on us that we used AI to help build a model and score AI. At the end of the day this is our framework. Is it perfect? Definitely not. What we do hope it tells you is where your portfolio stands, which in a trade this large, is the thing you control.
Nearly half the S&P is one theme. The same theme shows up as a chip designer in California, a foundry in Taiwan, a robot maker in Japan — and the risk isn't the same in any two of them. There's no sector tag that will surface it for you, and the fund or index you happen to pick can double it without asking.
This isn't buy or sell. Know your number and know what kind. A 12% AI weight is perfectly defensible. So is 45%. What is hard to defend is a shrug. Because in 2026, this shrug is a position, and a big one.
Ask the question about your portfolio. Not knowing if its full of hotdogs or not, is not an acceptable answer. And if you would like some help, reach out to us.
— Spencer Morgan at Purpose Investments, with a little help from Craig Basinger
Get the latest market insights in your inbox every week.
Sources: Charts and data are sourced to Bloomberg L.P. unless specified otherwise, as of July 23, 2026.
The content of this document is for informational purposes only and is not being provided in the context of an offering of any securities described herein, nor is it a recommendation or solicitation to buy, hold or sell any security. The information is not investment advice, nor is it tailored to the needs or circumstances of any investor. Information contained in this document is not, and under no circumstances is it to be construed as, an offering memorandum, prospectus, advertisement or public offering of securities. No securities commission or similar regulatory authority has reviewed this document, and any representation to the contrary is an offence. Information contained in this document is believed to be accurate and reliable; however, we cannot guarantee that it is complete or current at all times. The information provided is subject to change without notice.
Commissions, trailing commissions, management fees and expenses all may be associated with investment funds. Please read the prospectus before investing. If the securities are purchased or sold on a stock exchange, you may pay more or receive less than the current net asset value. Investment funds are not guaranteed; their values change frequently, and past performance may not be repeated.
Certain statements in this document are forward-looking. Forward-looking statements (“FLS”) are statements that are predictive in nature, depend on or refer to future events or conditions, or that include words such as “may,” “will,” “should,” “could,” “expect,” “anticipate,” “intend,” “plan,” “believe,” “estimate,” or other similar expressions. Statements that look forward in time or include anything other than historical information are subject to risks and uncertainties, and actual results, actions, or events could differ materially from those set forth in the FLS. FLS are not guarantees of future performance and are, by their nature, based on numerous assumptions. Although the FLS contained in this document are based upon what Purpose Investments and the portfolio manager believe to be reasonable assumptions, Purpose Investments and the portfolio manager cannot assure that actual results will be consistent with these FLS. The reader is cautioned to consider the FLS carefully and not to place undue reliance on them. Unless required by applicable law, it is not undertaken, and is specifically disclaimed, that there is any intention or obligation to update or revise FLS, whether as a result of new information, future events, or otherwise.


