
A white paper on the investment case for global resource companies in 2026.
Introduction
Every resource cycle eventually attracts the same familiar narrative: prices have risen, therefore exposure to the sector should increase. But investing in global resource companies has never been about simply following commodity prices higher. Resource cycles are shaped by longer-term changes in supply, demand, capital investment, and geopolitics. The more important question for 2026 is therefore not whether resources have already performed well, but whether the structural forces shaping the next phase of the cycle remain intact.
The evidence suggests that they do.
Recent resource performance has benefited from geopolitical uncertainty, supply constraints, and changing global demand. But the opportunity extends beyond recent commodity-price performance. Years of constrained capital investment, increasingly concentrated supply chains, geopolitical fragmentation, and new sources of resource demand are creating conditions that could support the earnings power of resource companies for years to come.
The distinction matters. A broad “long commodities” approach does not fully capture the opportunity. Different parts of the resource sector are being driven by different structural forces: energy security, precious-metals demand, electrification, artificial intelligence infrastructure, and the growing need for base metals and critical minerals. For investors, the opportunity lies in identifying the companies positioned to benefit from these long-term changes rather than simply reacting to short-term movements in commodity prices.
The investment case for global resource companies in 2026 rests on four structural pillars: two on the supply side and two on the demand side.
On the supply side, first, years of capital discipline have left parts of the resource industry structurally under-built. Resource production is dependent on continual investment because existing fields and mines decline and new projects require substantial capital and long development timelines.
In oil and gas, the International Energy Agency estimates that almost 90% of annual upstream investment since 2019 has been required simply to offset production declines rather than meet demand growth. It also estimates that, absent further investment, global oil production would decline by roughly 8% annually over the next decade. New conventional projects take almost 20 years on average from exploration license to first production.¹
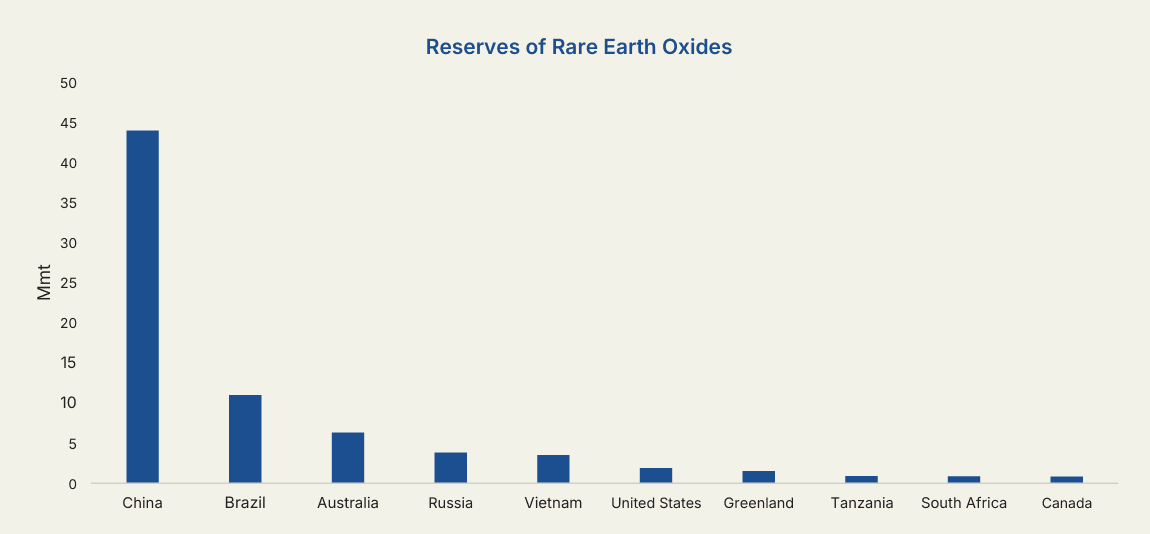
Second, the supply that does exist is increasingly concentrated geographically. China holds roughly 70% of the world's rare-earth reserves,² while Indonesia has become the dominant producer of mined nickel, accounting for an estimated 62% of global mine production in 2025 and potentially approaching 70% in 2026.³ The Democratic Republic of Congo has introduced export quotas for cobalt,⁴ while Russia remains a major player in uranium enrichment and nuclear fuel.⁵ These concentrations give producing nations greater influence over global supply chains and have encouraged consuming countries to pursue more diversified, geopolitically aligned sources of supply.
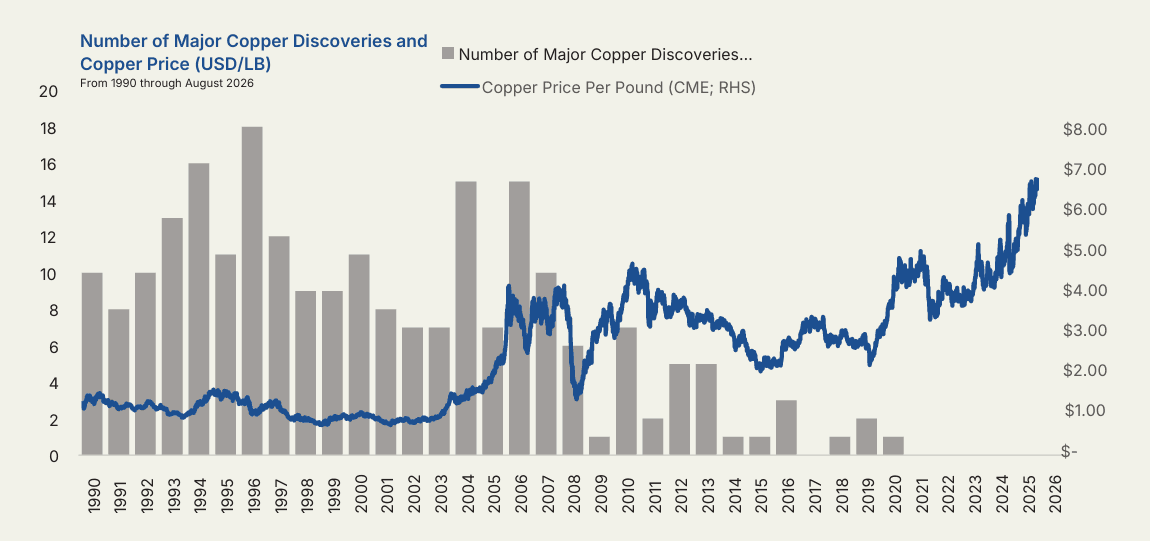
On the demand side, electrification and artificial intelligence are creating a new and potentially durable source of metals demand. Copper is particularly important because of its role in electricity transmission, power generation, data centers, electronics, and broader electrification. S&P Global estimates that global copper demand could rise from 27 million tonnes in 2025 to 42 million tonnes by 2040, with supply falling short by roughly 10 million tonnes by 2040 absent substantial new mining investment.⁶
Finally, the deterioration of the US fiscal position is changing the investment landscape for stores of value. The Congressional Budget Office projects that US federal debt held by the public will rise from 101% of GDP in 2026 to 120% in 2036, well above the previous post-war record.⁷ This backdrop has reinforced interest in assets that are not liabilities of another government, particularly gold. Gold has subsequently gained importance in official reserves, reaching 27% of global central bank reserve assets at the end of 2025, overtaking US Treasuries, whose share fell to 22%.⁸
Taken together, these forces make the resource thesis broader than a conventional commodity cycle. The opportunity does not depend on a single commodity outperforming or on a temporary supply disruption persisting. It rests on multiple independent changes in the global economy: declining supply from existing assets, concentrated control of strategic resources, rising physical demand from electrification and AI, and increasing investor interest in hard assets.
This distinction is particularly important in the current market regime. The investment framework of the previous decade relied heavily on the diversification benefits of government bonds. When growth was the dominant macroeconomic risk, bonds often rallied as equities sold off. The post COVID environment has been different, with sticky inflation, supply constraints, fiscal concerns, and geopolitical risk playing a larger role in determining asset returns.
Resource companies therefore deserve consideration not simply as a tactical expression of commodity prices, but as businesses positioned at the intersection of these structural forces. The remainder of this paper examines the four pillars supporting the resource opportunity before considering what the changing market regime and significant dispersion within the resource universe imply for portfolio construction.
Pillar 1 , Underinvestment
Years of capital discipline across the resource industry have left producers increasingly dependent on a limited stock of existing assets and a pipeline of projects that can take years, and sometimes decades, to develop.
The key point is that resource supply does not respond quickly to higher prices. Existing oil fields decline, mines deplete, and new projects require exploration, permitting, financing, construction, and infrastructure before they generate production. Consequently, investment decisions made today determine the availability of supply several years into the future.
The oil and gas industry illustrates this dynamic particularly clearly. The IEA estimates that almost 90% of upstream investment since 2019 has been directed toward offsetting production declines rather than meeting incremental demand. Its analysis of roughly 15,000 fields finds average observed post-peak decline rates of 5.6% annually for conventional oil and 6.8% for conventional natural gas. Without capital investment, natural declines would be considerably steeper, with global oil production falling by around 8% per year over the following decade.¹
The challenge is not simply the amount of capital required, but the time required for that capital to translate into production. The IEA estimates that new conventional oil and gas projects have taken almost 20 years on average from exploration license to first production.¹ Mining projects face similarly long development periods, particularly where permitting, infrastructure, environmental requirements, and community negotiations are involved.
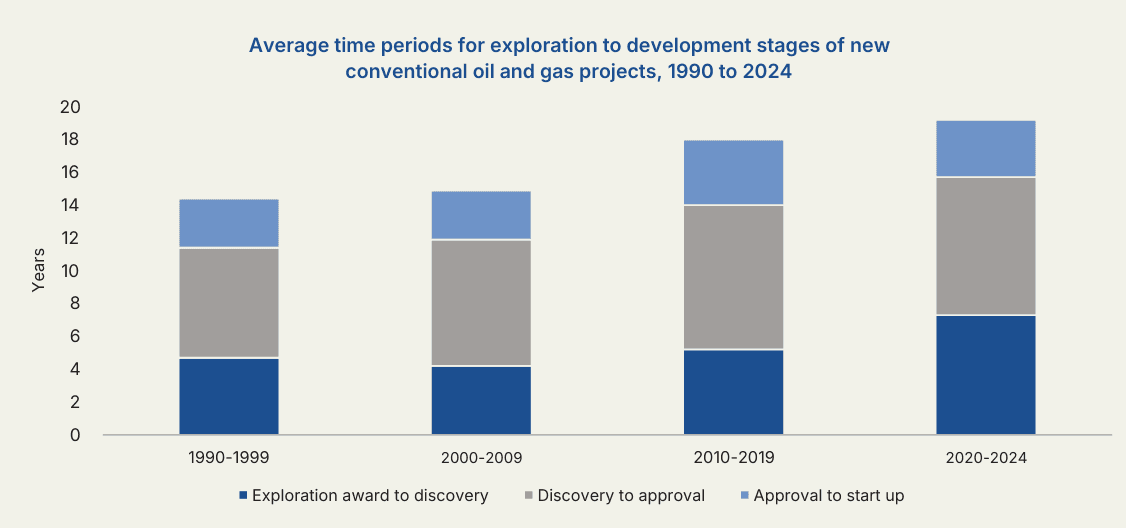
The same structural constraints apply to mining, where long development timelines, substantial capital requirements, and permitting and infrastructure challenges can make supply equally slow to respond to changes in demand.
Independent research from the IEA and S&P Global both put the global average time from discovery to first production for mining projects at roughly 15 to 18 years comparable to, and in some cases longer than, the almost-20-year timeline the IEA cites for conventional oil and gas.⁹ The trend is lengthening rather than shortening: S&P Global's research shows the average lead time for gold, copper, nickel, and lithium mines that began production between 2020 and 2023 reached 17.9 years, up from just 12.7 years for mines developed between 2005 and 2009.¹⁰
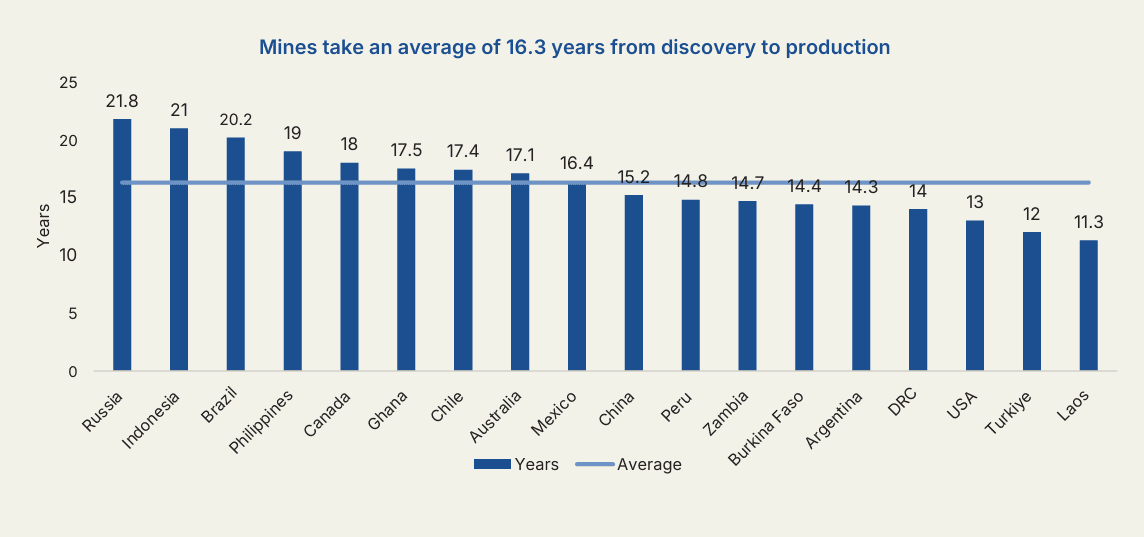
In the United States specifically, S&P Global estimates that new critical-mineral mines take an average of 29 years from discovery to production , the second-longest timeline of any country in its study, behind only Zambia at roughly 34 years.¹¹ A 1999 National Research Council study found that only about one in 1,000 mineral prospects ultimately becomes an economically viable mine, underscoring how much exploration risk sits upstream of these already lengthy development timelines.⁹
Copper illustrates this dynamic particularly clearly, given its importance to the electrification- and AI-driven demand growth discussed later in this paper. Rio Tinto and BHP's Resolution Copper project in Arizona , one of the largest untapped copper deposits in the world , was discovered in 1995. More than three decades and over $2 billion of spending later, the project had still not produced a pound of copper as of 2026, delayed primarily by permitting reviews and litigation.¹² Northern Dynasty's Pebble project in Alaska, one of the largest undeveloped copper-gold deposits globally, has been in exploration or permitting review for more than two decades without reaching a construction decision.¹³ Extended timelines are not unique to the United States: S&P Global cites Russia's Bystrinskoye copper mine, which took 32 years from its 1986 discovery to start-up in 2018.¹⁰
Gold projects in remote jurisdictions show a similar pattern. In the Canadian Arctic, Agnico Eagle's Meadowbank deposit in Nunavut was discovered in 1994 and did not reach commercial production until March 2010, a 16-year span.¹⁴ Its neighboring Meliadine deposit, discovered in 1990, took 29 years to reach commercial production in 2019.¹⁵ Hope Bay, where gold was first discovered in the 1990s, saw a smaller-scale operation begin in 2017 before being suspended for cost reasons; Agnico Eagle, which acquired the project in 2021, is now targeting a larger-scale restart as early as 2030 , nearly four decades after the original discovery.¹⁶ The short shipping season, extreme remoteness, and additional infrastructure and community requirements associated with Arctic development help explain why mining timelines can extend even beyond the lengthy averages already observed in oil and gas.
This creates an asymmetric supply response. Prices can rise quickly, but production cannot. Even when higher commodity prices improve project economics, the additional supply may arrive years after the initial signal.
For investors, this creates an important distinction between commodity prices and resource-company earnings. If supply growth remains constrained while demand continues to expand, producers with high-quality existing assets, long reserve lives, and disciplined capital allocation can benefit from stronger pricing and higher cash generation without requiring the entire sector to enter another aggressive investment cycle.
Underinvestment therefore represents more than a cyclical shortage. It is a structural constraint on the ability of the industry to respond rapidly to future demand.
Pillar 2 , Geopolitical Fragmentation & Resource Nationalism
The question of who controls resource supply chains has become almost as important as the question of how much supply exists.
China's dominance of rare-earth processing is the clearest example. China holds roughly 70% of the world’s rare-earth reserves, giving it significant influence over materials essential to electronics, defense, advanced manufacturing, and other strategic industries.²
The same dynamic is emerging across other commodities. Indonesia has become the dominant force in global nickel production, with its share of global mine output estimated at roughly 62% in 2025 and projected to approach 70% in 2026.³ The Democratic Republic of Congo has also moved toward greater control of its cobalt supply through export restrictions and quotas, contributing to significant price volatility.⁴
Uranium provides another example. Russia remains a major participant in international nuclear-fuel supply chains, particularly in enrichment. This creates a strategic vulnerability for Western consumers as governments seek to expand nuclear generation while simultaneously reducing dependence on Russian supply. The United States banned imports of Russian-produced low-enriched uranium in 2024, with limited waivers available only through the end of 2027, a reminder that substituting away from concentrated supply takes years, not quarters.⁵
The Strait of Hormuz provides a broader example of how geopolitical control over critical infrastructure can translate into resource scarcity. The waterway carried an average of 20 million barrels per day of crude oil and oil products in 2024, equivalent to around 25% of global seaborne oil trade. Alternative routes can bypass only an estimated 3.5 to 5.5 million barrels per day, leaving a large share of regional supply dependent on the Strait. The exposure is even greater for natural gas: around 93% of Qatar’s and 96% of the United Arab Emirates’ LNG exports transit the Strait, representing almost 20% of global LNG trade.¹⁷
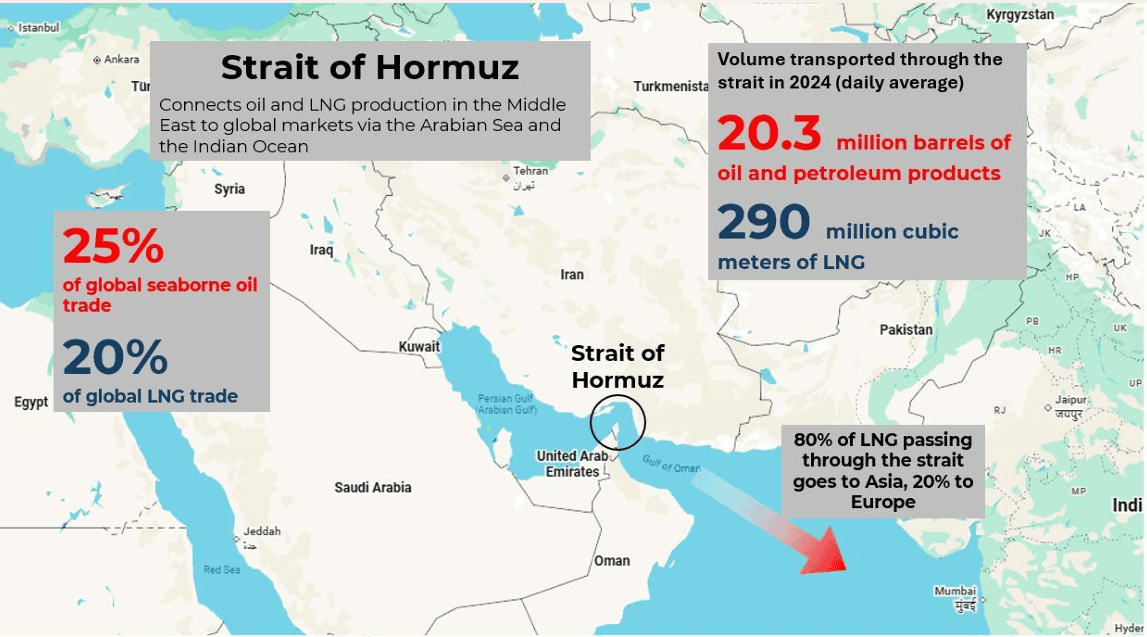
The 2026 closure of the Strait demonstrates how quickly a geopolitical event can transform physical resource abundance into effective scarcity. By September 15, 2026, only four commodity vessels had transited the Strait on the previous day, compared with a pre-conflict average of roughly 125 daily transits.¹⁸ The disruption has affected not only the availability of oil and gas, but also the cost and reliability of global supply chains, reinforcing a broader point for resource investors: security of supply depends not only on the location and ownership of natural resources, but also on the infrastructure, transportation routes, processing facilities, and political relationships required to move those resources from producer to consumer.
These examples point to a broader structural change: resource nationalism is no longer confined to oil-producing countries. Governments increasingly view critical minerals, energy, and processing capacity as strategic assets. Export controls, domestic processing requirements, production quotas, and state participation are becoming more common tools of industrial policy.
Importing countries are responding by attempting to diversify supply chains. The United States, Europe, Japan, and other major economies are increasingly supporting domestic production, allied-country supply chains, recycling, processing capacity, and alternative sources of strategic materials. The consequence for investors is significant. Resource scarcity is no longer purely a function of geology. A mineral can be abundant globally while remaining scarce to a particular country or industrial system if access to production or processing is concentrated in a small number of jurisdictions.
The consequence for investors is significant. Resource scarcity is no longer purely a function of geology. A mineral can be abundant globally while remaining scarce to a particular country or industrial system if access to production or processing is concentrated in a small number of jurisdictions.
This increases the strategic value of high-quality assets located in stable jurisdictions and companies capable of providing supply outside dominant geopolitical blocs. Over time, this could support higher required returns on new resource projects and create opportunities for producers that can provide secure, diversified supply.
Pillar 3 , Electrification & AI-Driven Demand
The demand side of the resource equation is undergoing a structural change of its own.
Electrification is increasing the amount of physical infrastructure required to generate, transmit, store, and consume electricity. Artificial intelligence adds a new layer to this trend through the rapid construction of data centers, power infrastructure, and associated transmission networks.
Copper sits at the center of this investment cycle because of its combination of electrical conductivity, durability, and widespread use across power infrastructure and electronics.
S&P Global estimates that global copper demand will increase from approximately 27 million tonnes in 2025 to 42 million tonnes by 2040, a roughly 50% increase. Without substantial new investment in mining supply, the resulting shortfall could reach roughly 10 million tonnes by 2040, around 25% below projected demand even assuming recycled copper scrap more than doubles over the period.⁶
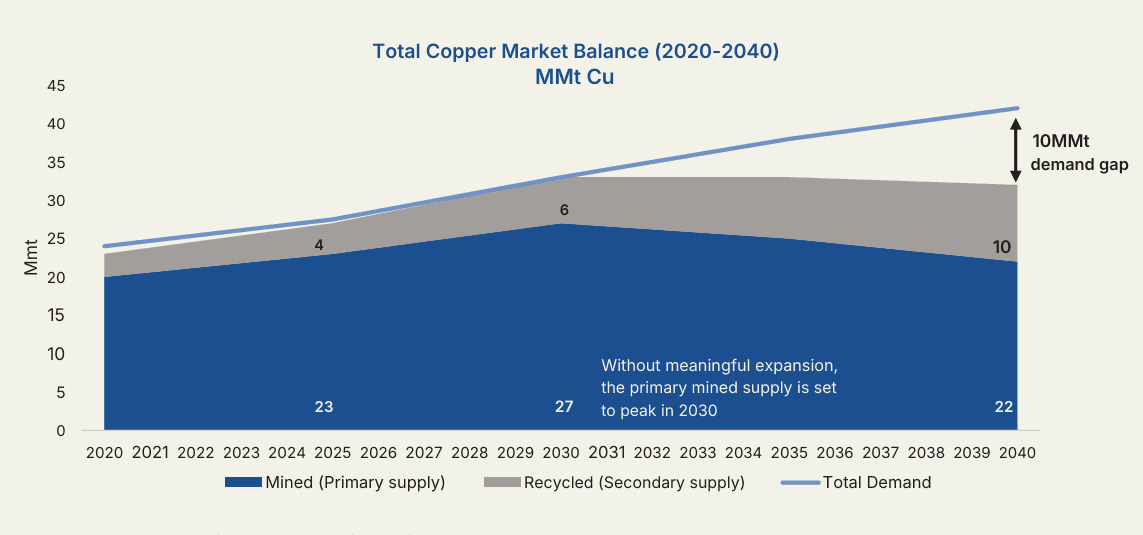
Importantly, this forecast does not depend exclusively on aggressive energy-transition policy. S&P's analysis assumes copper demand continues to rise across a broader range of applications, including AI, defense, robotics, infrastructure, and traditional consumption.⁶
AI is therefore important not because it creates an entirely new commodity category, but because it accelerates investment in electricity-intensive infrastructure. Data centers require large quantities of power, which in turn requires generation, transmission, transformers, substations, and grid expansion. The physical infrastructure supporting AI ultimately creates demand for the same underlying resources required by broader electrification.
This creates a potentially durable source of demand that differs from previous commodity cycles. Traditional resource cycles were often driven primarily by industrial production, construction, transportation, or Chinese infrastructure investment. The current cycle adds a second layer of demand associated with digital infrastructure and the physical buildout required to support it.
The implication is not that every base metal will benefit equally. Rather, the strongest opportunities are likely to occur where structural demand growth intersects with constrained supply and long development timelines.
Pillar 4 , US Fiscal Trajectory & Demand for Hard Assets
The fourth pillar is slower moving but potentially broader in its implications: the deterioration of the US fiscal position and the resulting debate over the role of traditional reserve assets. The Congressional Budget Office projects that federal debt held by the public will rise from 101% of GDP in 2026 to 120% in 2036. It also projects that the federal deficit will increase from 5.8% of GDP in 2026 to 6.7% in 2036, with net interest costs rising from 3.3% to 4.6% of GDP over the same period.⁷
These figures do not by themselves imply a collapse in the US dollar or Treasury market. The United States retains substantial institutional, financial, and geopolitical advantages, and Treasuries remain central to the global financial system.
The more relevant investment question is whether investors increasingly seek diversification away from financial assets that depend on the creditworthiness and policy choices of governments. Gold is the clearest expression of this trend. Unlike bonds or currencies, gold is not another country's liability. Its role as a reserve asset therefore becomes more relevant when investors are concerned about fiscal sustainability, currency purchasing power, geopolitical fragmentation, or the long-term reliability of traditional reserve assets.
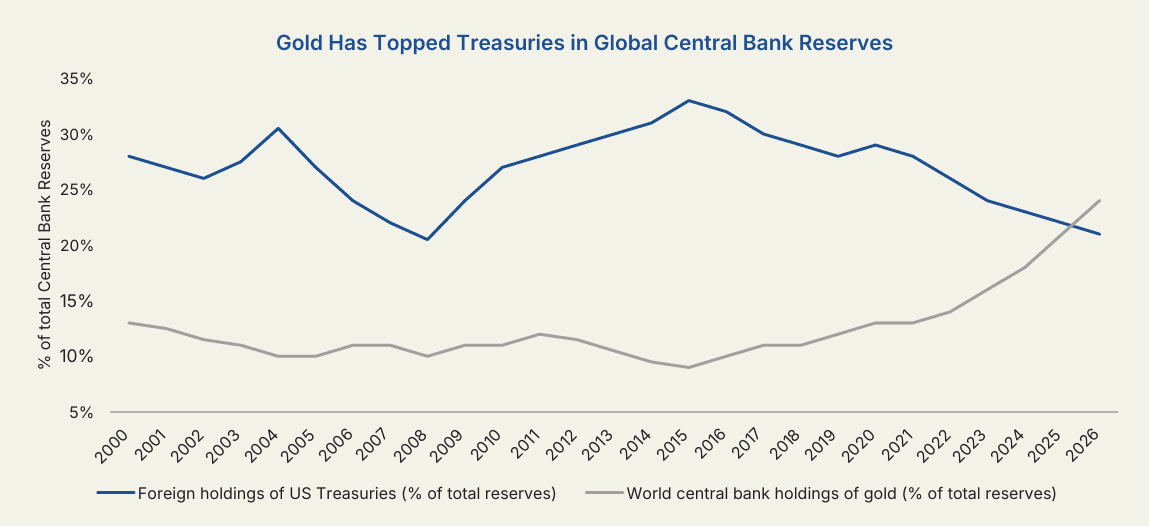
This creates a distinct demand channel for resource equities. Gold producers provide exposure not only to the underlying commodity, but to the companies that own and operate the assets capable of producing it. In an environment of sustained demand for gold, operating leverage can allow high-quality producers to generate disproportionately greater changes in cash flow as prices rise.
The broader point is that the resource opportunity is not solely about industrial demand. It also encompasses demand for scarce physical assets as stores of value.
Inflation, Correlation Breakdown & the Diversification Case
The structural case for resources is only part of the investment argument. The other part is how resource equities behave within a broader portfolio.
For much of the first two decades of the 21st century, government bonds provided an effective counterweight to equities. When growth expectations deteriorated and equity markets sold off, falling inflation and lower interest rates often supported bond prices. That relationship weakened significantly once inflation became a more important driver of markets.
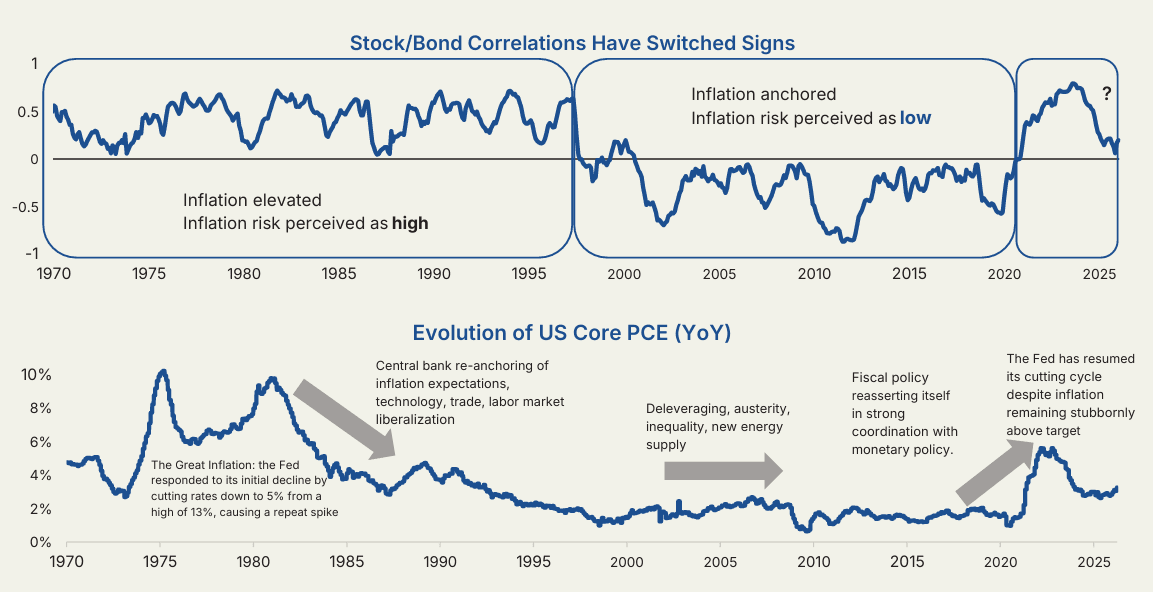
In an inflationary or supply-constrained environment, the traditional relationship between stocks and bonds can become less reliable. Resource companies can behave differently because their underlying businesses are linked directly to the prices of physical commodities.
This does not mean resource equities are inherently defensive. They remain cyclical businesses, and their share prices can experience substantial volatility. But their earnings are influenced by a different set of economic variables than those driving many traditional financial assets. The result is a potentially valuable diversification characteristic: resource equities can provide exposure to inflation-sensitive cash flows at a time when conventional fixed income may provide less protection against inflation shocks.
This makes the asset class particularly relevant in a market regime defined by persistent fiscal deficits, supply constraints, geopolitical risk, and potentially higher structural inflation than investors experienced during the pre-COVID period.
Sector Dispersion Within the Asset Class
Understanding why resources matter structurally is only half the investment case. The other half is understanding how differently the individual resource subsectors behave.
Precious metals, base metals, energy, agriculture, and other resource segments are driven by different combinations of supply, demand, geopolitics, and macroeconomic conditions. Treating “resources” as a single trade can therefore obscure the dispersion that exists beneath the surface.
The historical record demonstrates this clearly. Between 2011 and 2025, the gap between the best- and worst-performing resource subsectors averaged approximately 64 percentage points, while even the narrowest annual spread was 21 percentage points. In twelve of those fifteen years, the resource complex contained both a clear winner and a clear loser.¹⁹
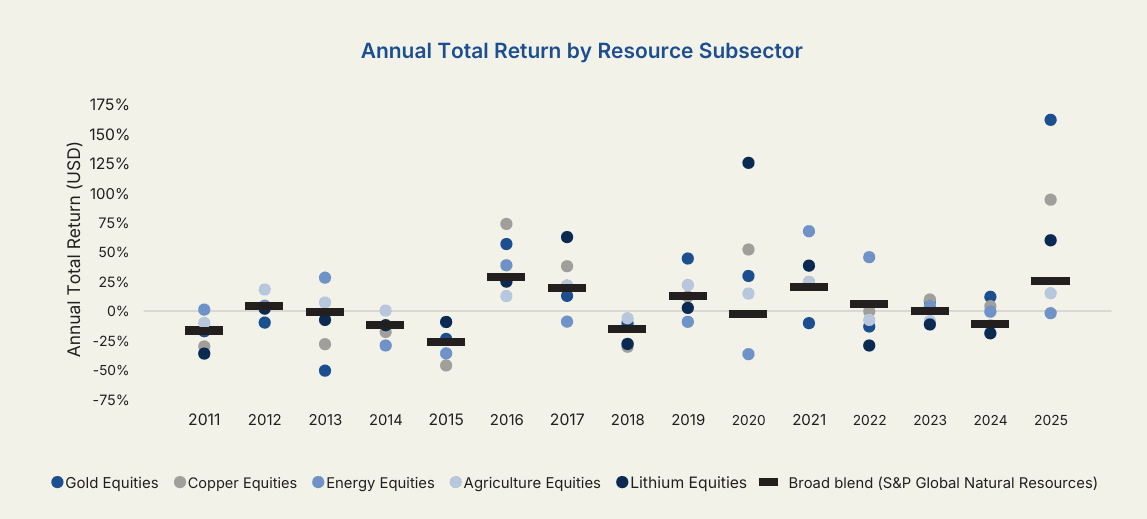
Leadership also changed frequently. Eleven of fourteen annual transitions saw a different subsector move into first place, while each of the five subsectors led the group at least once and trailed it at least once.¹⁹
Energy provides the clearest illustration. Its annual returns showed limited relationship with gold, copper, or lithium over the period. In 2020, for example, energy producers fell 37% while lithium and battery metals rose 126%, a 162-percentage-point difference within the same broad resource universe.¹⁹
The broad index therefore does not eliminate the allocation decision. It embeds one.
Over the fifteen-year period, the S&P Global Natural Resources Index generated less than 1% annualized returns and compounded to only about 7% in total, while individual resource subsectors produced outcomes ranging from significant losses to gains approaching 100%.¹⁹
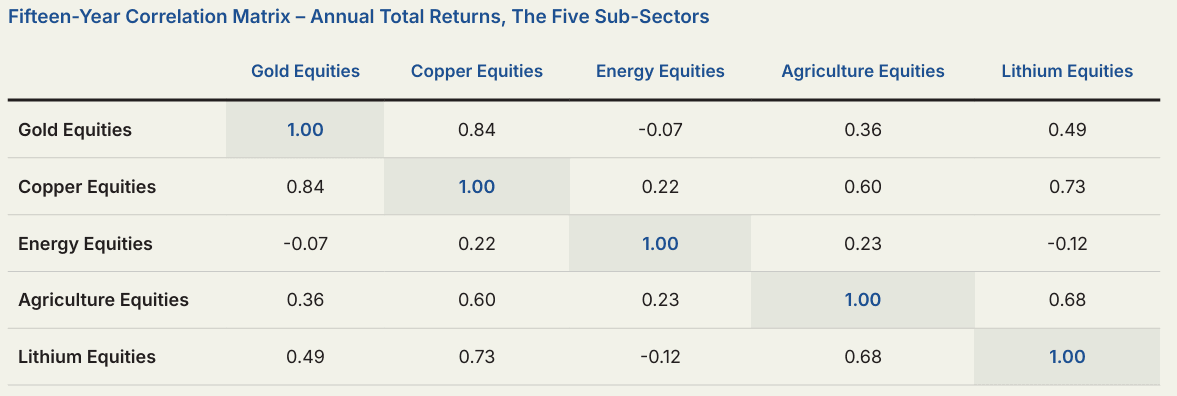
The lesson is not that broad resource exposure has no value. It is that sector allocation and security selection can be decisive. A resource portfolio constructed around the structural forces described above may look materially different from a market-cap-weighted natural-resources index.
Portfolio Construction Implications
The four pillars point toward a resource allocation that is deliberate rather than indiscriminate.
A broad commodity exposure provides one way to participate in higher resource prices, but it does not necessarily capture the full economic value created by constrained supply. Equity ownership adds exposure to the companies that own, develop, and operate the underlying assets.
This distinction matters because resource equities can benefit through several channels: commodity prices, operating leverage, reserve growth, capital allocation, production growth, and the potential rerating of scarce assets.
At the same time, security selection introduces its own risks. Two companies exposed to the same commodity can produce very different investment outcomes depending on asset quality, jurisdiction, balance-sheet strength, capital discipline, cost structure, reserve life, and management execution.
Portfolio construction should therefore consider both commodity exposure and asset quality.
The strongest structural opportunities appear where several characteristics overlap:
- Long-life, low-cost assets with attractive reserve bases.
- Exposure to commodities facing constrained long-term supply.
- Assets located in stable or increasingly strategic jurisdictions.
- Companies capable of growing production without excessive capital requirements.
- Strong balance sheets that allow companies to remain disciplined through commodity downturns.
- Management teams with a demonstrated record of capital allocation and shareholder returns.
- Exposure to multiple structural demand drivers rather than reliance on a single short-term commodity trend.
The subsector mix should likewise reflect the different roles that resources can play within a portfolio. Precious metals can provide exposure to monetary and fiscal uncertainty; base metals can provide exposure to electrification, infrastructure, and AI-related demand; energy can provide exposure to energy security and supply constraints; and selected agricultural or other resource exposures can provide additional diversification.
The objective is therefore not simply to own “commodities.” It is to own the companies best positioned to benefit from a world in which physical resources are becoming strategically more important, supply is increasingly difficult to expand, and demand is being reshaped by electrification, AI, geopolitics, and changing preferences for stores of value.
Conclusion
The investment case for global resource companies in 2026 extends beyond the recent strength in commodity prices. Years of underinvestment, declining existing assets, concentrated supply chains, and resource nationalism are constraining the ability of producers to respond quickly to new demand. At the same time, electrification, AI, energy security, and demand for hard assets are creating new and potentially durable sources of resource demand.
This does not mean that all commodities or resource companies will benefit equally. Significant dispersion across subsectors highlights the importance of active allocation and security selection. Companies with long-life, low-cost assets, strong balance sheets, attractive jurisdictions, and disciplined management are better positioned to convert structural resource scarcity into sustainable shareholder returns.
For investors, the opportunity is therefore not simply to be “long commodities,” but to own the companies best positioned at the intersection of constrained supply, structural demand growth, geopolitical fragmentation, and the growing strategic importance of physical assets. In an environment where traditional diversification may be less reliable, resource equities can provide differentiated exposure to these long-term forces.
Sources
¹ International Energy Agency, The Implications of Oil and Gas Field Decline Rates, September 2025. https://www.iea.org/reports/the-implications-of-oil-and-gas-field-decline-rates
² Mining Technology, “China continues to dominate rare earths as diversification efforts gain momentum,” March 2026. https://www.mining-technology.com/analyst-comment/china-dominate-rare-earths/
³ International Nickel Study Group, The Market 2025-12.
⁴ Reuters, analysis of the Democratic Republic of Congo's cobalt export quotas and the impact on cobalt prices.
⁵ World Nuclear Association, US Nuclear Fuel Cycle (country profile), accessed August 2026. https://world-nuclear.org/information-library/country-profiles/countries-t-z/usa-nuclear-fuel-cycle
⁶ S&P Global, Copper in the Age of AI: The Challenges of Electrification, January 8, 2026. https://pages.marketintelligence.spglobal.com/Copper-in-the-Age-of-AI—download.html
⁷ Congressional Budget Office, The Budget and Economic Outlook: 2026 to 2036, February 2026. https://www.cbo.gov/publication/62105
⁸ BofA Global Investment Strategy, BofA Global Research, World Gold Council, IMF, Bloomberg as of February 2026
⁹ Society for Mining, Metallurgy & Exploration (SME), White Paper on Exploration and Mine Permitting Timelines, April 2025. https://smenet.blob.core.windows.net/smecms/sme/media/smeazurestorage/about%20sme/pdf%20files/sme-white-paper-on-exploration-and-mine-permitting-timelines-april-2025.pdf
¹⁰ S&P Global Market Intelligence, “Average lead time almost 18 years for mines started in 2020-23,” 2024. https://www.spglobal.com/market-intelligence/en/news-insights/research/average-lead-time-almost-18-years-for-mines-started-in-2020-23
¹¹ S&P Global, “United States Ranks Next to Last in Development Time for New Mines that Produce Critical Minerals for Energy Transition,” July 18, 2024. https://press.spglobal.com/2024-07-18-United-States-Ranks-Next-to-Last-in-Development-Time-for-New-Mines-that-Produce-Critical-Minerals-for-Energy-Transition,-S-P-Global-Finds
¹² MINING.COM, “Timeline: Rio Tinto's 26-year struggle to launch Arizona's Resolution copper project.” https://www.mining.com/web/timeline-rio-tintos-26-year-struggle-to-launch-arizonas-resolution-copper-project/
¹³ Wikipedia, “Pebble Mine” (project history, Northern Dynasty Minerals / Pebble Limited Partnership). https://en.wikipedia.org/wiki/Pebble_Mine
¹⁴ Wikipedia, “Meadowbank Gold Mine.” https://en.wikipedia.org/wiki/Meadowbank_Gold_Mine
¹⁵ Mining Technology, “Meliadine Gold Project, Nunavut”; Agnico Eagle Mines, Meliadine mine history. https://www.mining-technology.com/projects/meliadine-gold-project-nunavut/
¹⁶ CIM Magazine, “Agnico Eagle advances Hope Bay redevelopment,” 2026; Agnico Eagle Mines, Hope Bay operations. https://magazine.cim.org/en/news/2026/agnico-eagle-advances-hope-bay-redevelopment-en/
¹⁷ International Energy Agency, “Strait of Hormuz,” updated February 2026. https://www.iea.org/about/oil-security-and-emergency-ission/strait-of-hormuz
¹⁸ Reuters, “Hormuz traffic dwindles after Middle East attacks intensify,” September 15, 2026. https://www.reuters.com/world/middle-east/hormuz-traffic-dwindles-after-middle-east-attacks-intensify-2026-09-15/
¹⁹ S&P Global Natural Resources Index and underlying resource-subsector return data, 2011-2025.
Disclaimers
This document is for advisor use only and is intended for informational and educational purposes. It is not being delivered in the context of an offering of any securities, nor is it a recommendation or solicitation to buy, hold or sell any security. No securities commission or similar regulatory authority has reviewed this document. Information contained in this document is believed to be reliable but has not been independently verified. Material contained in this publication should not be considered legal, tax, investment, financial or other professional advice.
Portfolio-construction observations are general commentary and not tailored advice for any individual investor.
Certain statements in this document are forward-looking. Forward-looking statements (“FLS”) are statements that are predictive in nature, depend on or refer to future events or conditions, or that include words such as “may,” “will,” “should,” “could,” “expect,” “anticipate,” “intend,” “plan,” “believe,” “estimate” or other similar expressions. FLS are not guarantees of future performance and are by their nature based on numerous assumptions. Although the FLS contained in this document are based upon what Purpose Investments believes to be reasonable assumptions, Purpose Investments cannot assure that actual results will be consistent with these FLS. Index returns referenced are historical and do not reflect fees or expenses. Past performance may not be repeated. Third-party data and research cited herein are the property of their respective owners.