
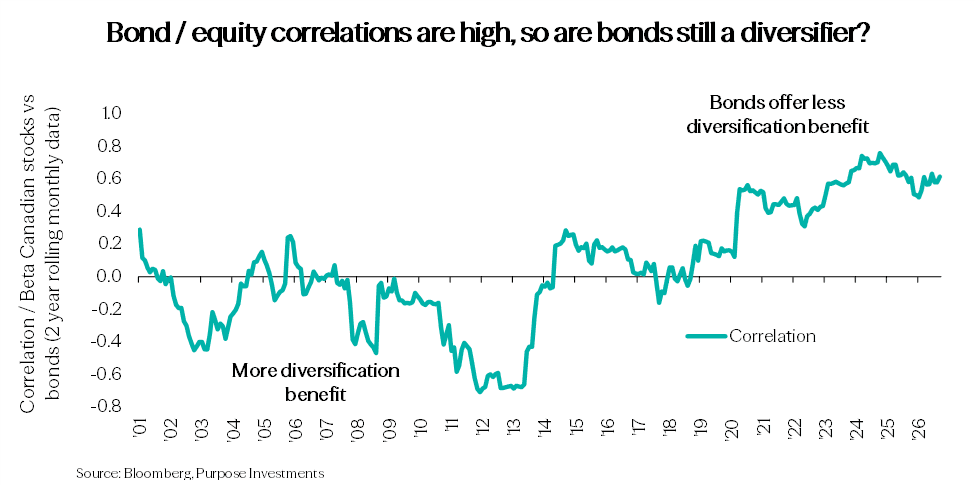
I know you are probably sitting there saying ‘what diversification?’, my bonds are down and correlations with equities are certainly positive. The bond/equity correlation remained largely negative or close to zero for the two decades from 2000 to 2020. But since 2000, correlations have risen, causing many to question the diversification benefit of bonds. No denying these facts but would point out the more important question, what are you looking for diversification from today? The answer is your exposure to the AI bubble. As this bubble gets bigger, my portfolio needs more allocations to things that will offset any disruption to the continued inflation of this bubble.
As we make our way across the country for our annual road show, something has changed. In past conversations, we would always get some push back when labelling the AI revolution a ‘bubble’, citing the infrastructure spend coming from existing cashflows or valuations not being extreme. More recently, there is no longer any push back on the bubble label. Perhaps it is because the top 10 companies in the market capitalization weighted S&P 500 Index (“S&P 500” ) are now all AI plays to some degree.
It is a helluva list: Nvidia, Apple, Alphabet, Microsoft, Amazon, Broadcom, Meta, Micron, Telsa and AMD. These names, the top 10 in the S&P 500, carry a 41% weight in the index. And it is not just the S&P 500, there is a sizeable AI exposure in many markets from emerging markets, Japan and to a lesser extent Europe and Canada. The AI infrastructure buildout is also driving global economic growth. And with massive debt issuances to fund this build, it is also driving the bond market. It is big and it is everywhere. So as this theme goes, so goes the market and economic growth.
That is not a bad thing given these top 10 companies in the S&P 500 are expected to report about $270 billion in earnings as the Q3 season kicks off. These are real earnings and real dollars. We certainly wouldn’t want to be void of exposure to AI heading into earnings season, token demand is rising, use cases are rising, and AI revenue is growing. But with any bubble the natural questions arise: how far will it go and when will it stop going? Because when it stops, look out. Stay tuned for a more in-depth dive into this bubble, its durability and what to watch out for in a future ethos.
Diversifying AI Risk? The Answer Is Bonds
AI now drives stock prices across many sectors and regions, and a material share of global economic growth. Rather than fretting over bond/equity correlations, let’s scenario test it: run the AI bubble forward under a few different potential scenarios and based on our mental models and experience share how different asset classes may behave.
Scenarios At a Glance
|
Scenario |
Stocks |
Bonds |
For a stock and bond portfolio |
|
1 Bubble keeps inflating Capex-fuelled,
1 to 3 years |
▲ Up |
▼ Down |
Equities carry the portfolio |
|
2 Productivity gains arrive The
holy grail |
▲ Up |
◆
Mixed |
Equities carry the portfolio |
|
3 Bubble deflates Months
or quarters |
▼ Down |
▲ Up |
Bonds cushion the drawdown |
Bonds can lag in the first two scenarios, but that is the cost of insurance. In the third, they potentially do their traditional job of diversifying equity and economic risk.
Scenario 1: The Bubble Keeps Going in a Linear Fashion
Bubbles don’t end at a certain size or duration, and they have gone much further than most expected. Plus who knows what inning we are in today. Hyperscalers are spending more than $200 billion per quarter on AI infrastructure to meet rising demand. Sustaining that pace requires ever more capital, and increasingly it comes from the bond market.
|
Capex keeps rising $200B+ per quarter and
growing |
Funding need grows More issuance in the bond
market |
Yields rise Higher yields attract the
capital needed |
Earnings and growth hold Capex drives earnings, the
economy and yields |
Outcomes - Spending-driven boom continues with ▼ Bonds down ▲ Stocks up
Yields keep rising to attract capital, so bond prices fall. Equities, especially AI-sensitive ones, keep rising as earnings expand. The same demand puts upward pressure on energy and commodity prices. In a nutshell, the awesome markets we have all enjoyed over the past couple years continues.
Scenario 2: Productivity Gains Show Up
Capex normalizes and supply catches up with demand. Earnings growth spreads from the builders of AI infrastructure to its users. This is the holy grail: strong growth with higher productivity. Layoffs may rise beyond coders, which puts some downward pressure on inflation and yields. Hyperscalers start earning a return on their capex, and companies using AI see rising margins.
|
Capex normalizes Capex continues but pace of
growth slows |
Funding need slows Slowing supply helps yields
come down |
Yields mixed Yields stabilize or come down
a bit on productivity gains alleviating inflation |
Earnings and growth hold AI infrastructure earnings
growth slows but AI users see improving productivity and margins |
Outcomes – AI infrastructure spending growth slows but benefits broaden ◆ Bonds mixed ▲ Stocks up
Slowing earnings growth among AI infrastructure names causes some weakness but this is offset by AI benefits for firms in many other industries and sectors. This helps the market breadth improve and over time helps alleviate market concentration. Productivity gains may result in labour weakness which also helps yields come down. This would be a very optimistic outcome.
In either scenario 1 or 2 bonds might struggle but who cares? The equity side of the portfolio keeps doing all the lifting for the portfolio. S&P 20,000, why not.
Scenario 3: The Bubble Deflates
The bubble deflates in the coming months or quarters or years. Why it deflates is obviously unknown. Perhaps free competing LLM models limit how much revenue can be generated. Or those tech labs that continue to develop this technology find approaches that don’t use as much compute, again making the return on investment for all these data centers challenging. Or maybe the spending just starts to normalize. It is often the pace of acceleration or deceleration that matters, which may put downward pressure on valuations in the AI space.
Transmission
|
Capex slows Infrastructure spending slows |
Earnings growth slows Hits AI-related stocks first |
Economy slows Slowing growth boost may
coincide with other economic weakness |
Recession risk Bear market for stocks |
Outcomes – Bubble deflates ▼ Stocks down ▲ Bonds up
This may be the higher probability scenario, but we could have scenario 1 for a while then scenario 3. The key takeaway is this bubble has already inflated enough to be the dominant factor driving stocks globally. And it has grown big enough that its contribution to global economic growth is material enough that a change in trajectory would meaningfully slow economic growth.
And Yields Are Juicy
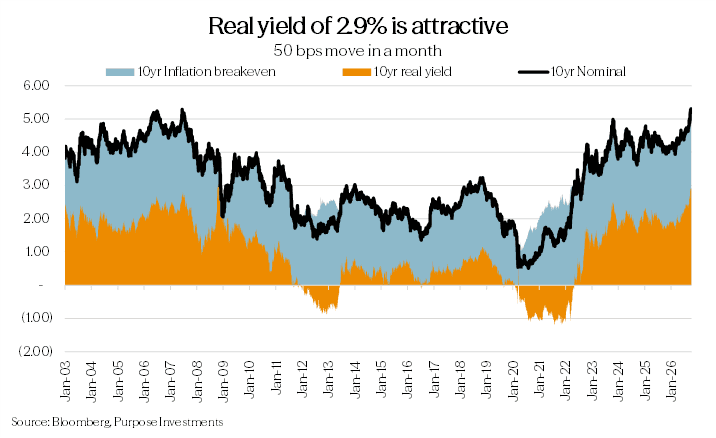
Obviously yields are up globally with the bellwether U.S. 10-year around 5.25%. This is pretty much multi decade highs and to see a higher nominal yield you have to go back to the last technology bubble. Real yields are up a lot too, which means this isn’t a move on inflation, it is a combination of economic growth and increased supply. Real yield of 2.9% is attractive.
Final Thoughts
We believe these yields look rather appealing on their own, with full disclosure we thought that when the U.S. 10-year was at 4.85% as well. There is no doubt these yields can go higher. One solace is with each tick higher in yields, the future expected return improves, and yields have to go up by larger amounts to trigger a negative total return.
However, this is more about using bonds to allow other parts of the portfolio continue to lean into the AI bubble. Bonds might not be a diversifier on a week to week or month to month basis, but we believe they are a good diversifier for portfolio AI exposure.
— Craig Basinger & Derek Benedet at Purpose Investments.
Get the latest market insights in your inbox every week.
Sources: Charts are sourced to Bloomberg L.P., as of October 9, 2026.
The content of this document is for informational purposes only and is not being provided in the context of an offering of any securities described herein, nor is it a recommendation or solicitation to buy, hold or sell any security. The information is not investment advice, nor is it tailored to the needs or circumstances of any investor. Information contained in this document is not, and under no circumstances is it to be construed as, an offering memorandum, prospectus, advertisement or public offering of securities. No securities commission or similar regulatory authority has reviewed this document, and any representation to the contrary is an offence. Information contained in this document is believed to be accurate and reliable; however, we cannot guarantee that it is complete or current at all times. The information provided is subject to change without notice.
Commissions, trailing commissions, management fees and expenses all may be associated with investment funds. Please read the prospectus before investing. If the securities are purchased or sold on a stock exchange, you may pay more or receive less than the current net asset value. Investment funds are not guaranteed; their values change frequently, and past performance may not be repeated.
Certain statements in this document are forward-looking. Forward-looking statements (“FLS”) are statements that are predictive in nature, depend on or refer to future events or conditions, or that include words such as “may,” “will,” “should,” “could,” “expect,” “anticipate,” “intend,” “plan,” “believe,” “estimate,” or other similar expressions. Statements that look forward in time or include anything other than historical information are subject to risks and uncertainties, and actual results, actions, or events could differ materially from those set forth in the FLS. FLS are not guarantees of future performance and are, by their nature, based on numerous assumptions. Although the FLS contained in this document are based upon what Purpose Investments and the portfolio manager believe to be reasonable assumptions, Purpose Investments and the portfolio manager cannot assure that actual results will be consistent with these FLS. The reader is cautioned to consider the FLS carefully and not to place undue reliance on them. Unless required by applicable law, it is not undertaken, and is specifically disclaimed, that there is any intention or obligation to update or revise FLS, whether as a result of new information, future events, or otherwise.


