
This one likely has something for everyone: flows have lifted Canada’s equity market causing an interesting dispersion, dividend yields down bond yields up, tariffs 2.0 and to kick things off, we are entering a challenging seasonal period for markets.
As summer winds down markets are now headed into the more challenging season the often feared September and October gambit. Why this happens, well who knows. Maybe after the historically lower volume summer months, investors return from their summer break and want to make changes. Perhaps because sunny days have a correlation to the U.S. market on a daily basis, and there are fewer sunny days ahead. Don’t get excited, it is a weak correlation and if you were going to follow it, you would then be investing based on the weather persons prediction for sun the next day.
Whatever the reason, we are entering these challenging months. For both the S&P/TSX Composite Index (“TSX”) and the S&P 500 Index (“S&P 500”), September has historically been the weakest month on average. Averages can hide more than they reveal, but the percentage of up months and the median have been lowest too. October has often been pretty wild with greater dispersion before the much more pleasant November/December kick in. TSX has suffered even more during this period.
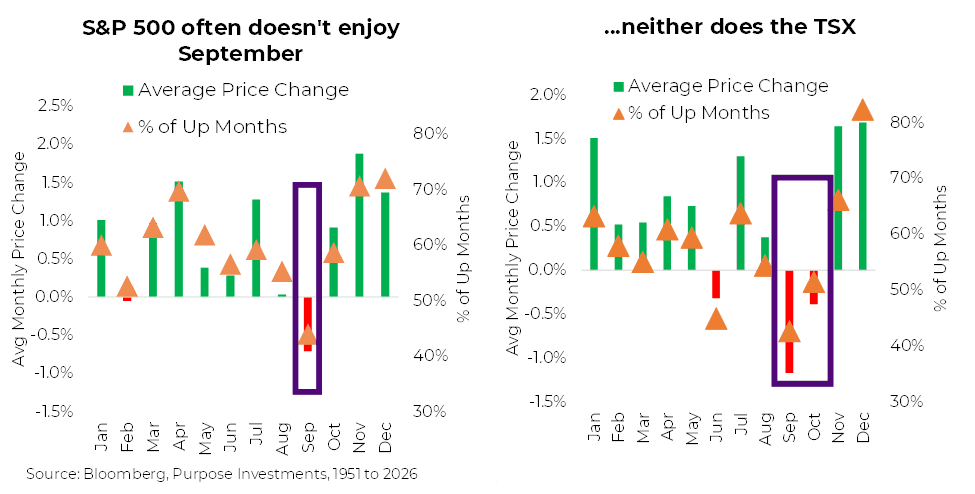
An additional twist, U.S. Midterm elections are approaching. We could data mine the heck out of this, make some fun charts, quote a bunch of averages. Instead, let’s all just agree this is a more challenging time for markets. Throw on a good economy, AI bubble, bond yields getting too high, Hormuz still somewhat closed, awesome earnings, new tariffs…it may sound daunting but let’s not forget markets are up decently so far this year and posted pretty awesome gains for the past couple years. Maybe we are due for a few bumps as the weather starts to turn.
Don’t Touch the Tap
How ever you choose to measure it, the inflows into Canadian equities have been well above longer term trends over the past few quarters. Many narratives explaining these flows. After decades of increasing U.S. equity exposure among global portfolios, a trend appears to have surfaced that is marginally more balanced. This has put increased flows into Canada, Europe, Asia and emerging markets. Not saying money is coming out of the U.S., but on the margin, a new dollar is going a little more outside the U.S. compared to years past.
Maybe driven by policy uncertainty, concentration risks or simply looking to diversify. Perhaps our new leadership or resource heavy index have attracted flows. Whatever the motivation, this has really helped the TSX. Based on Bloomberg total return indices in Canadian dollars, over the past two years Canada is #1 vs U.S., Asia, Europe and emerging markets.
Once you are done celebrating our rank, there is an interesting byproduct of these flows beyond simply lifting the TSX higher. Canada is not that liquid of a market, as once you get below the top 30 names or so, it can take a while to build or exit a position. Past the top 60 names, you better be prepared to hold onto that name for a while. As a result, when global flows increase, most of those dollars likely get directed into the Canadian megacaps [not to be confused with U.S. megacaps, that is a whole different league].
This is evident in the following chart. For S&P/TSX 60 Composite Index (“TSX 60”) constituents, which are all somewhat large caps, it breaks out the performance of the smallest quartile (Small) vs the Largest (Big). This diversion really accelerated in 2026 as inflows into Canada increased.
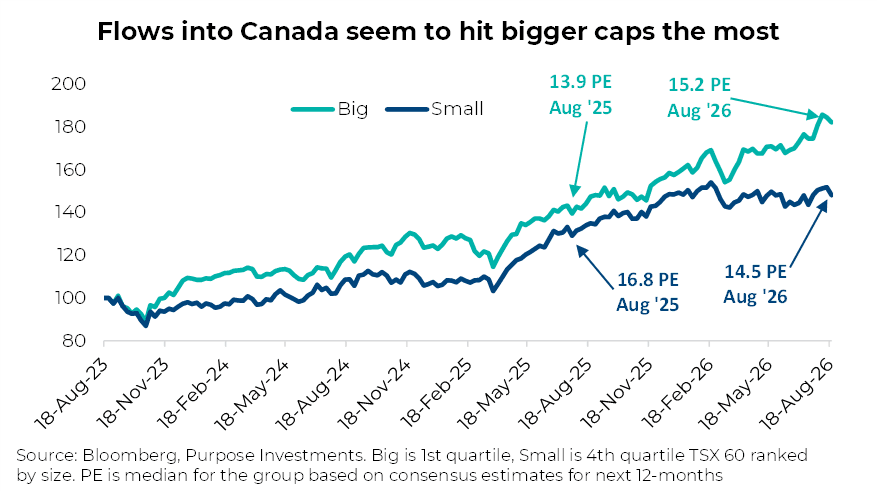
So, if you are confident the increased flows into Canadian equities, from international and domestic investors will continue, let those Canadian megacaps ride!! That is mainly banks, Shopify, rails, big gold miners, biggest energy names and biggest pipes. Alternatively, if the flow from the money tap slows down, well that poses a challenge. While impossible to calculate, a good portion of the past price advance is likely supported by these steady inflows.
Meanwhile, the smaller cohort appears to be offering better value. Remember, the small cohort is still among the top 60 companies by size in Canada, with market caps ranging from $8 to $35 billion. The forward estimate median PE ratio for the Big quartile has risen from 13.9 to 15.2x while the Small PE ratio has fallen from 16.8 to 14.5x.
We would love for the flows to continue but are currently finding better opportunities a little further down the size spectrum in the Canadian market.
Yield to Temptation
Bond yields have risen steadily higher in recent months; the move is global and across the curve. Short-term rates have surged on increasingly hawkish central bank expectations, while long bond yields have climbed to levels not seen in roughly two decades. Canada's 30-year sits at levels last reached in 2009, and Japan's 30-year now yields the same as ours. There is no single driver. Rising inflation expectations, strong economic growth and swelling sovereign debt levels are the kneejerk explanations, while the crowding out of government debt by massive hyperscaler bond issuance is a newer twist. Whatever the mix, the marginal buyer has changed. Price-insensitive holders of government debt are giving way to price-sensitive ones, and price-sensitive buyers demand to be paid.
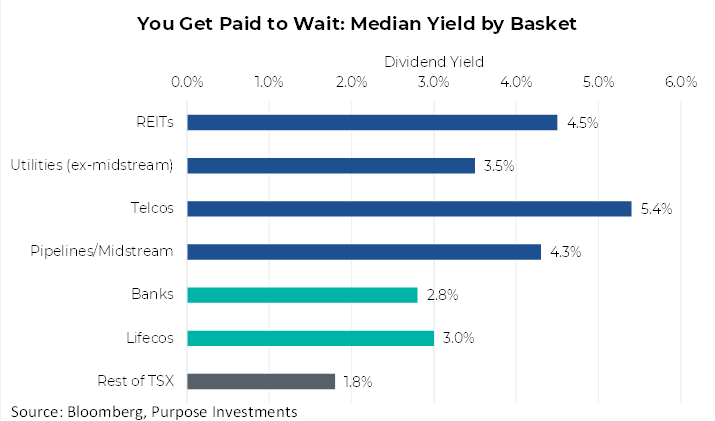
Bond yields have an impact on just about every other investable market. Within equities, long-duration growth plays feel it, and so do the safer defensive "bond proxies." For the first time in nearly a decade, Canadian utilities yield less than a Government of Canada 10-year bond (3.62% vs 3.76%). Looking back, that has happened on just 2.2% of trading days since 2017. The chart below details selects equity groups and their yield spread versus the Canadian 10-year bond. When the “risk-free” alternative pays more than a utility, it is perhaps worth reconsidering from an asset allocation perspective [air quotes added to ‘risk-free’ as most investor likely don’t view government bonds as risk-free given recent performance]. These dividend to bond yield spreads didn't narrow because dividend payouts were cut, it vanished because the risk-free alternative repriced while equity markets rallied. Each of the higher-yield groups now sits in the bottom quartile of its own decade spread history. Real Estate is the lone exception, the only group whose dividend yield actually rose over the past year. Within our multi-asset portfolios, we’ve added to fixed income, partly for the improved yield and partly to be a bit more tactically defensive heading into the fall. The equity side is where it gets more interesting.
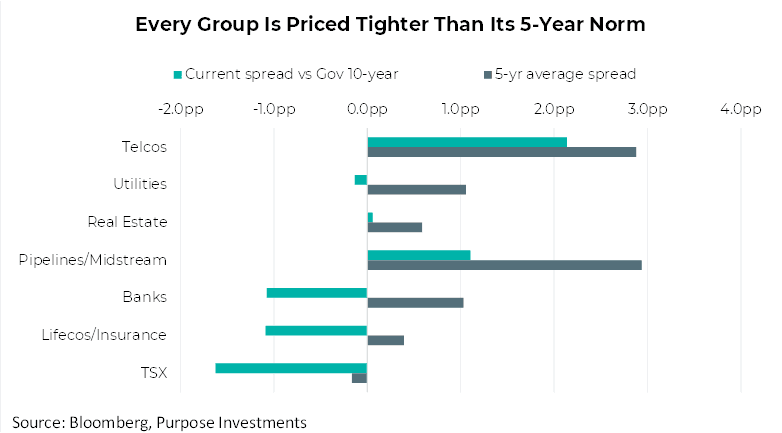
Through an equity-only lens, the recent move lower in the highly rate-sensitive sectors has our attention. Avoiding or underweighting groups like Utilities, Pipelines and REITs has been a decent call. The recent re-rating in prices and uptick in dividend yields has made them more attractive in our estimation. The market has been selling yield at an aggressive pace over the past month. Breaking the TSX into quintiles based on dividend yield and it's the highest yielders that have been hit hardest. Median RSI (Relative Strength Index) in the top quintile is bordering on technically oversold, the share of names in bullish trends has collapsed, and it is the only quintile trading below its 200-day moving average. Sorry if I got a bit technical on you.
Utilities and REITs have broken down while Banks and Lifecos sit at the opposite end of the spectrum. Our interest clearly isn't momentum driven; it's a relative value, contrarian stance. When selling is indiscriminate and factor driven rather than based on fundamentals, it stands a good chance of creating company-level mispricing.
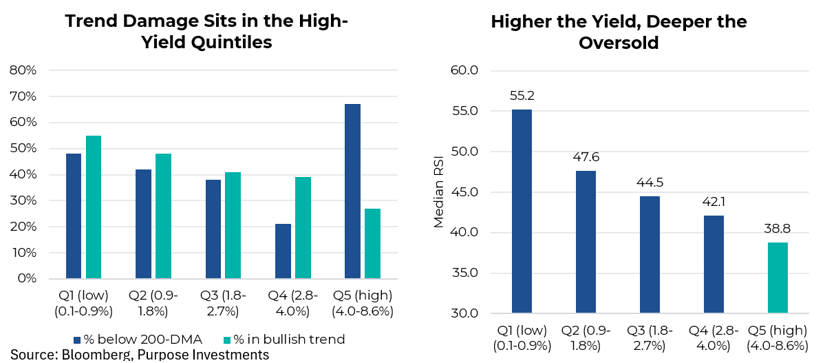
After three-plus years of very strong returns, deep value is extremely hard to find. Valuations for the rate sensitives are more attractive than they were a short time ago, but they are certainly not cheap on an absolute basis. Only telcos look cheap against their own history, offering a higher yield than their decade norm. With the TSX now yielding under 2%, quality companies with attractive yields and reasonable valuations have become scarce. That is why relative value, and relative yield, matter. Canadian Banks, lifecos and energy producers sit at or near all-time highs, well ahead of their long-term moving averages and carrying elevated valuations. Contrast that with the sudden repricing in the rate sensitives, which suddenly look relatively attractive. Not cheap by any means, but closer to normal than the rest of the market. Relativity matters.
Within our dividend mandates, we have begun scaling into more interest-rate-sensitive stocks. We recently doubled our pipeline exposure, focusing on the laggards, and added some industrial real estate. We are habitually early; contrarian entries into strong downtrends usually are. The risk to the trade is straightforward: if tight labour markets reignite wage inflation, the bond rally never arrives, and spreads normalize through lower prices instead. So far, the realized data points the other way, with inflation expectations well anchored despite the hawkish turn in central bank rhetoric, but it is the scenario we are watching. We are not calling a top in yields. However, with rates at cycle highs and approaching levels where they have topped out repeatedly over the past few years, we like the trade from a risk/reward standpoint. Adding some defensive, lower-beta exposure ahead of a seasonally weak period doesn't hurt either. This is not a major repositioning; it’s more of a subtle tilt adding on weakness. Higher yields are tempting and we’re beginning to nibble.
Tariffs 2.0
Markets are giant learning machines, or perhaps it’s the investors that are constantly learning along the way. Recalling the first riots in the streets of Athens which marked the start of the European debt crisis in 2010. Markets sold off as we watched angry citizens square off against lines of police. A month later, riots broke out again and markets didn’t care anymore. Surprises out of left field will shock markets, like learning Greece is broke and has had to cut spending. If an event is less of a surprise, the market response is often rather muted. However, the slower moving long-term implications are often ignored and carry more lasting impacts.
TSX reacted very negatively to the surprise tariffs on Liberation Day in 2025, but had a muted response to this latest tariff escalation. Maybe markets learned that escalation is often followed by de-escalation as in the 2025 chain of events. Or have markets simply become numb to tariffs akin to the 2nd outbreak of riots in Athens? The bigger challenge will be the longer-term impacts as the Canadian economy adjusts to greater trade policy uncertainty and to more east-west trade vs simply going south.
We don’t know if this spat will de-escalate or if Canada renames Lake Erie to Lake Windsor. As it stands, this escalation could trim GDP by an estimated 0.3% based on a few economist projections. Not great but also not nearly as dire as the original projections following Liberation Day. As we tend to focus more on markets, our concern is this muted response could well be too muted.
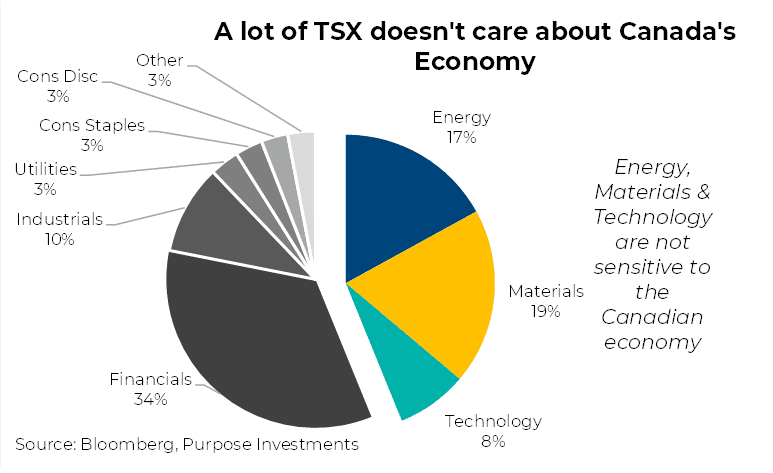
We do have a mild cautious view on the Canadian equity market, which pre-dated this latest tariff escalation and was more driven by already booked strong gains and high valuations. Higher tariff implications is an added risk but keep in mind most of the TSX doesn’t really care about the Canadian economy. Energy, Materials and Technology largely beat to a different drum. Energy and Materials are more sensitive to the global economy while Technology plus a large portion of Industrials and Financials are sensitive to what is happening in the U.S.
The trade tension escalation is a negative but there really hasn’t been a dislocation in the equity market to get us excited either way. In the meantime, let’s hope for a de-escalation but also recognize policy uncertainty is something we are likely going to have to live with.
Market Cycle
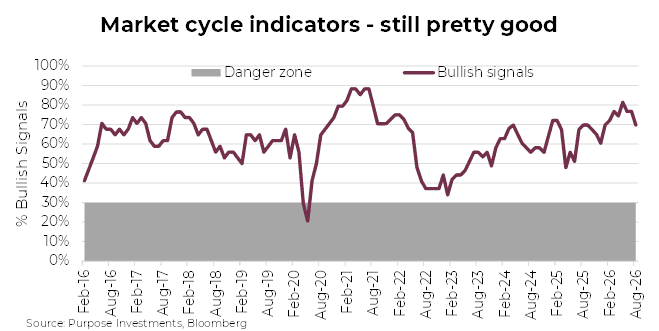
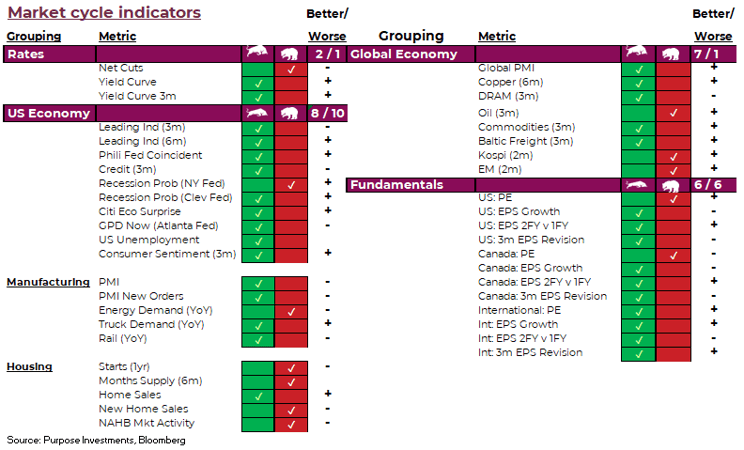
Market daily volatility continues to be driven by day-to-day macro news flow. Fed comments, AI varying enthusiasm, Hormuz, tariffs, etc. Underneath the noise is the economy and market fundamentals, which remain healthy. Global manufacturing continues to improve, helped by the AI infrastructure buildout. As these are cyclical parts of the global economy, it is helping drive earnings growth.
Good economy + good earnings = strong combinations. The recent dip in market cycle indicators, from a high starting point, is largely driven by housing. Given housing is one of the more interest rate sensitive components of the economy, not surprising to see softness given bond yields.
One of the dangers for this market is the consumer, namely the U.S. consumer. As we promised last month, below are our consumer indicators that have a history of signalling a turn in consumer spending. Four bearish and three bullish is a bit troubling but not alarm bell magnitude. This has been the same ratio for the past three months. Equity market, home prices and jobless claims are encouraging. Leading indicators, lending, sentiment and oil prices are not. The indicators have been pretty stable: 4 vs 3, for much of the past year. Based on some of our faster consumer measures including card spending and spending categories more driven by wealthy consumers, at the moment the consumer appears ok.
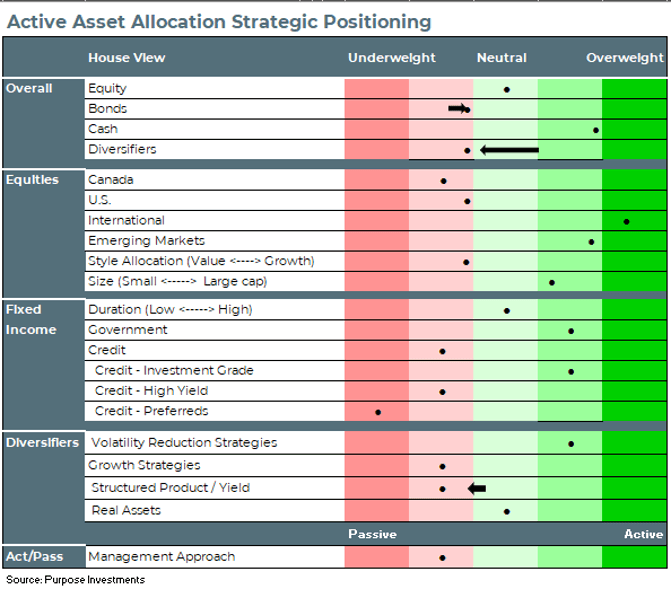
Portfolio positioning wise, we did some trading last month. With bond yield bouncing near the top of the multi-year range, we opted to reduce our structured yield exposure in diversifiers and add to bonds. This marginally increased the defensiveness of the portfolio, as our desire to become more defensive as markets move higher remains a theme. After outsized returns, we are comfortable becoming incrementally more defensive.
Final Thoughts
We understand the headlines may come across rather dire: war, tariffs, attempted lake renaming, etc. What doesn’t get as many headlines is a global economy doing well and solid earnings helping markets post solid performance. Unsure what might upset the applecart, we have some leading prospects, or it could be a total surprise. Nonetheless, after outsized gains we opt to lean incrementally more defensive.
— Craig Basinger & Derek Benedet at Purpose Investments.
Get the latest market insights in your inbox every week.
Sources: Charts are sourced to Bloomberg L.P., as of September 4, 2026.
The content of this document is for informational purposes only and is not being provided in the context of an offering of any securities described herein, nor is it a recommendation or solicitation to buy, hold or sell any security. The information is not investment advice, nor is it tailored to the needs or circumstances of any investor. Information contained in this document is not, and under no circumstances is it to be construed as, an offering memorandum, prospectus, advertisement or public offering of securities. No securities commission or similar regulatory authority has reviewed this document, and any representation to the contrary is an offence. Information contained in this document is believed to be accurate and reliable; however, we cannot guarantee that it is complete or current at all times. The information provided is subject to change without notice.
Commissions, trailing commissions, management fees and expenses all may be associated with investment funds. Please read the prospectus before investing. If the securities are purchased or sold on a stock exchange, you may pay more or receive less than the current net asset value. Investment funds are not guaranteed; their values change frequently, and past performance may not be repeated.
Certain statements in this document are forward-looking. Forward-looking statements (“FLS”) are statements that are predictive in nature, depend on or refer to future events or conditions, or that include words such as “may,” “will,” “should,” “could,” “expect,” “anticipate,” “intend,” “plan,” “believe,” “estimate,” or other similar expressions. Statements that look forward in time or include anything other than historical information are subject to risks and uncertainties, and actual results, actions, or events could differ materially from those set forth in the FLS. FLS are not guarantees of future performance and are, by their nature, based on numerous assumptions. Although the FLS contained in this document are based upon what Purpose Investments and the portfolio manager believe to be reasonable assumptions, Purpose Investments and the portfolio manager cannot assure that actual results will be consistent with these FLS. The reader is cautioned to consider the FLS carefully and not to place undue reliance on them. Unless required by applicable law, it is not undertaken, and is specifically disclaimed, that there is any intention or obligation to update or revise FLS, whether as a result of new information, future events, or otherwise.


