
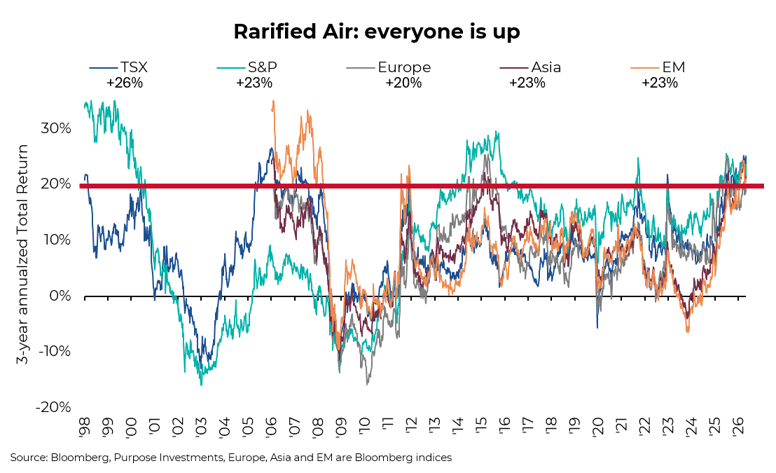
Developed markets have crushed it over the past three years. Sentiment is rightfully gleeful. Over the past three years, the S&P /TSX Composite Index (“TSX”), S&P 500 Index (“S&P 500”) and international markets have all compounded north of 20% annualized. Genuinely impressive returns, and relatively rare as well. The chart below, which shouldn’t be new to our regular readers, is really something to behold.
Over this 3-year period (ending July 31, 2026), the S&P/TSX Composite returned 86% cumulative and the S&P 500 around 70% (or 81% in Canadian dollar terms). Big numbers for these benchmark averages. Our curiosity led to a little digging to see what’s actually behind these numbers. Indices, especially concentrated ones, can easily hide who’s done the heavy lifting. Without digging into the attribution, it makes it more difficult to determine whether we should expect the good times to last, and also importantly, how much was due to great investment selection or how much was simply being in the right place at the right time. The classic skill vs luck paradigm.
Attribution in and of itself decomposes the headline returns into its drivers, typically which sectors and companies are driving returns. For a portfolio manager, it’s useful to see how much of a certain funds returns were also due to sector allocation vs security selection. While great at determining what drove returns, attribution does not specifically say what to do next; however, knowing the source of returns tells can lay clues as to how repeatable it is and how exposed you might be if leadership rotates.
Canada and the U.S.
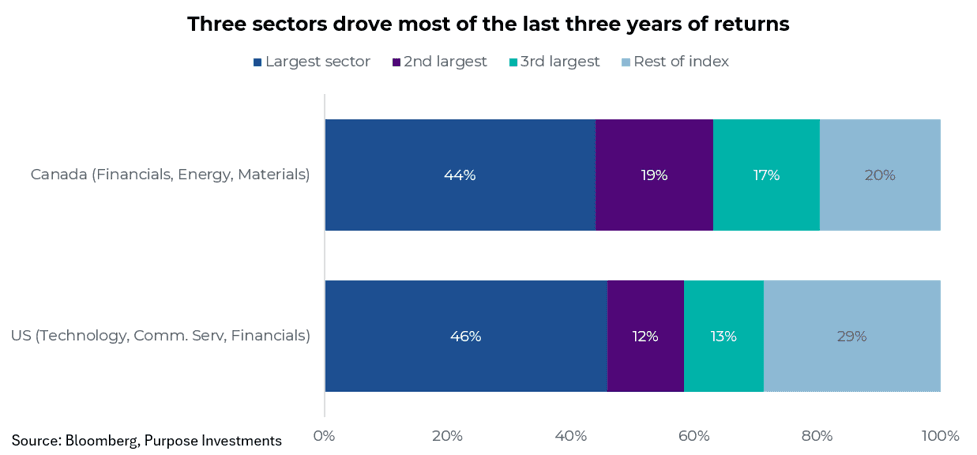
In Canada, it really shouldn’t be much of a surprise. The past three years have been all about banks, energy and gold. Over three years, Financials, Energy and Materials drove ~80% of the TSX’s total return. Financials alone drove 44%, with the top contributors being RBC, TD, CIBC, BMO and Scotiabank. Concentration remains a popular theme with the top 10 names driving 46% of the index return. Year to date the concentration is getting even more narrow. The big three sectors have driven 92% of the returns, with the top 10 carrying 65% of the burden. Energy has taken gold’s place this year behind the banks, but the latest surge in precious metals means the back half of the year could flip that back. Perhaps a reminder that leadership can be fleeting. Shopify was a top three contributor over the past three year but is the single largest detractor so far this year. From our perspective, this leadership in old economy sectors is one of the reasons why the dividend space has done so well. These companies are largely dividend paying, cash-generative quality companies. Though narrow, Canada’s narrowness behaves very differently than the tech heavy U.S. version.
South of the border, in the U.S., Technology has driven 46% of the return over the past three years. If we add in Communication Services that jumps up to 58%. That’s a lot of heavy lifting for AI. Nvidia alone contributed 10.6 points or roughly one seventh to the total index return. Impressive. Name concentration is slightly higher than Canada, with the top 10 contributing 52% of the return. Interestingly when we dig deeper this year, the breadth is starting to improve with 46% of S&P 500 constituents beating the index in the first half versus ~28-31% in each of the prior three years. The magnificence of the Mag 7 has also waned, as Tesla and Meta are among the YTD’s largest detractors. This year leadership has narrowed to memory and semis, with names like Micron, SanDisk, AMD and Intel posting eye popping returns. The AI theme remains strong, but the tide isn’t necessarily lifting all boats at this point.
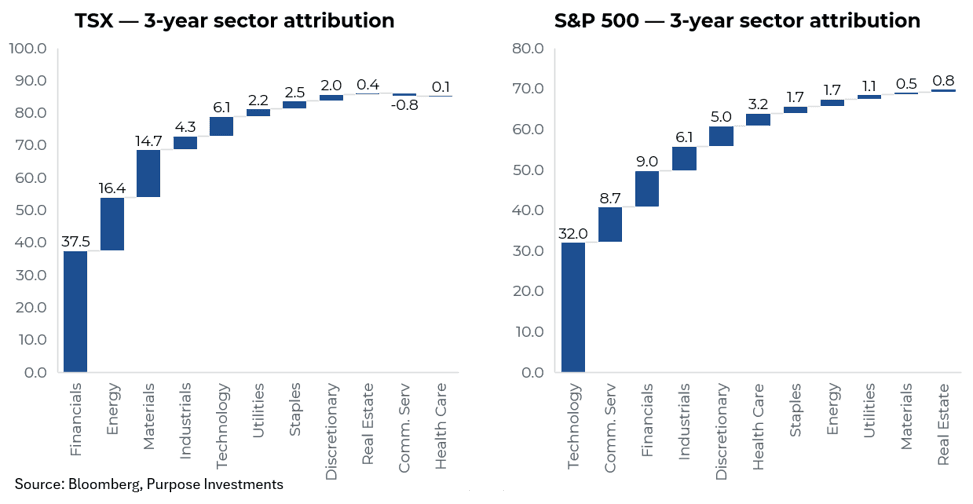
While the waterfalls tell a similar yet cluttered story, the chart below is better at contrasting where the returns have come from and how broad the returns have been. In Canada, outside of the top three sectors, the rest of the market has only contributed 20% to the total return. During that time period, Financials, Energy and Materials have each risen over 100%, punching well above their already lofty weights. In the U.S., Tech is the bigger star of the show, and the diversity is slightly better with the remaining sectors at least contributing 29% of the return. Overall, it’s a little shocking how narrow both markets have been, but they are focused on very different sectors.
Skill vs Luck
Now for a sobering look in the mirror. Whether you owned a lot of banks and energy names or simply the biggest tech companies on the planet, you made a lot of money. Is that skill? Or the happenstance of being invested in the largest, most liquid sectors in each country? A rising, narrow market is a confidence-manufacturing machine, and it quietly encourages some dangerous behavioural biases. Overconfidence, where we mistake beta for alpha. Hindsight bias, where the winner was "obviously" going to win. Outcome bias, where a good result launders a lucky call. And concentration creep, where winners grow into your largest positions right when they carry the most risk. We're not saying don't own the sectors that have worked. We're imploring some humility, ourselves included.
Final Thoughts
Narrow leadership doesn't always end badly, and a few strong years doesn't mean a sharp mean-reverting giveback is coming anytime soon. But these runs don't last forever. Too soon to tell, but we may already be seeing a leadership change in Canada. The banks are now down 6.7% (as of August 21) from their July highs, and with the resurgence in gold, this looks like some profit-taking and repositioning.
Markets are always in flux. Forward-looking investors would do well to assess the current state, look back at how we got here, and gauge how likely it is that today's leaders keep punching above their weight. In Canada, the banks are the obvious risk after driving outsized returns. Valuations are stretched, and even a return to merely normal growth could pressure multiples. In the U.S., the focus stays on the AI buildout, but for those willing to step away from the crowd, breadth is broadening, and that means more opportunity for investors willing to do a little digging. Knowing the source of returns is the first step to judging whether how repeatable they are.
— Derek Benedet at Purpose Investments.
Get the latest market insights in your inbox every week.
Sources: Charts are sourced to Bloomberg L.P., as of August 21, 2026.
The content of this document is for informational purposes only and is not being provided in the context of an offering of any securities described herein, nor is it a recommendation or solicitation to buy, hold or sell any security. The information is not investment advice, nor is it tailored to the needs or circumstances of any investor. Information contained in this document is not, and under no circumstances is it to be construed as, an offering memorandum, prospectus, advertisement or public offering of securities. No securities commission or similar regulatory authority has reviewed this document, and any representation to the contrary is an offence. Information contained in this document is believed to be accurate and reliable; however, we cannot guarantee that it is complete or current at all times. The information provided is subject to change without notice.
Commissions, trailing commissions, management fees and expenses all may be associated with investment funds. Please read the prospectus before investing. If the securities are purchased or sold on a stock exchange, you may pay more or receive less than the current net asset value. Investment funds are not guaranteed; their values change frequently, and past performance may not be repeated.
Certain statements in this document are forward-looking. Forward-looking statements (“FLS”) are statements that are predictive in nature, depend on or refer to future events or conditions, or that include words such as “may,” “will,” “should,” “could,” “expect,” “anticipate,” “intend,” “plan,” “believe,” “estimate,” or other similar expressions. Statements that look forward in time or include anything other than historical information are subject to risks and uncertainties, and actual results, actions, or events could differ materially from those set forth in the FLS. FLS are not guarantees of future performance and are, by their nature, based on numerous assumptions. Although the FLS contained in this document are based upon what Purpose Investments and the portfolio manager believe to be reasonable assumptions, Purpose Investments and the portfolio manager cannot assure that actual results will be consistent with these FLS. The reader is cautioned to consider the FLS carefully and not to place undue reliance on them. Unless required by applicable law, it is not undertaken, and is specifically disclaimed, that there is any intention or obligation to update or revise FLS, whether as a result of new information, future events, or otherwise.


