
The Purpose Active Suite, which includes the Purpose Active Conservative Fund (PACF), Active Balanced Fund (PABF) and Active Growth Fund (PAGF), turned three in October 2026. At the end of the month, the Active Suite returned between roughly 12% to 18%, annualized over three years, strong enough for a top 5% to top 15% ranking within its respective Morningstar categories. This also led to the addition of a fourth portfolio, the Purpose Active Equity Fund (PAEF).
From a product perspective, it's helpful to understand both what investors lived through while earning those returns, and how the funds are managed differently compared to their peers to achieve those results for investors.
Built to move
The Active Suite is commonly compared to passive asset allocation portfolios (widely referred to as "all-in-one" ETFs). These are great for providing beta through broad market exposure in a single fund, typically built from the provider's own index funds rather than funds from a range of managers. Over the past few years, they have served investors well as markets have generally had strong gains. These portfolios are also typically designed to hold the same mix of underlying investments and will usually rebalance at a set frequency or once the asset mix has drifted too far from its baseline.
The Active Suite on the other hand is built to move. Chief Market Strategist Craig Basinger and the multi-asset team use their proprietary model of market cycle indicators to shift each portfolio across cash, bonds, equities and diversifiers. They lean into areas (regions, sectors and/or asset classes) where they see the most opportunity and can add (or drop) funds from leading asset managers around the globe as their views change, something its passive peers are not designed to do.
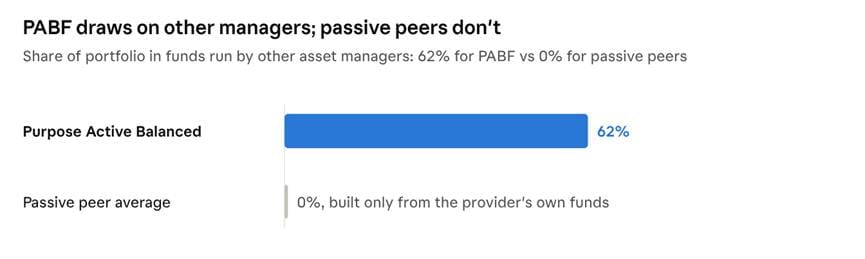
As a result, PABF turned over about 40% of its holdings in its latest fiscal year, roughly 6X the 7% of its passive peers. And every trade comes with a written rationale that is published online and distributed publicly for anyone to see. Below is one deliberate call that sets it apart from its passive peers i.e. holding less in U.S. stocks and more in Canada, Europe and Asia, which is important now as regions outside the U.S. have led the way over the past year.
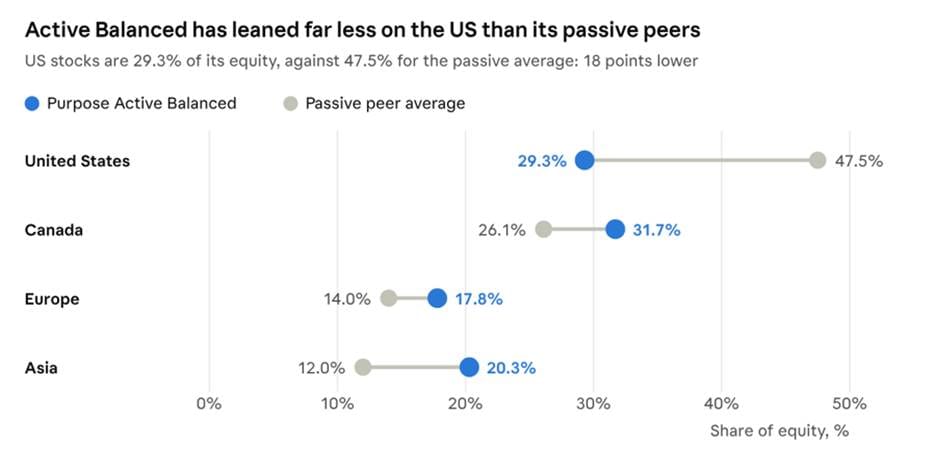
The impact of active trades
There are plenty of macro insights and investment calls that the team has made (e.g. gold, software, international, etc.), which can be found on our Portfolio Strategy page. That activity has led to the Active Suite having a lower worst drawdown, lower volatility and a higher Sharpe ratio than its passive peers over past three years.
|
Three
years to Oct. 31, 2026 |
Purpose
Active Balanced |
Passive
peer average |
|
Worst drawdown |
7.1% |
9.0% |
|
Annualized volatility |
6.9% |
8.3% |
|
Sharpe ratio |
1.72 |
1.56 |
Smaller drops do more than keep investors emotionally calm. Investment losses take more to recover than they cost (e.g. a 20% drop needs a 25% gain just to get back to par). That's a bigger problem if you need to pull money out along the way, since selling after a drop locks in the loss and leaves less to bounce back. Whether you're close to or in retirement, saving for a home, or paying for a child's tuition, a smoother path matters as much as the final number. A portfolio that reaches a similar place with fewer sharp drops is easier to plan around, and easier to stick with.
Active management without the active price tag
Active management usually costs more, and that cost comes out of returns. The Active Suite was built to avoid that trade-off. PABF's total annual cost, including management fees, other expenses and trading costs, was 0.42% (as of Dec 31, 2025). That's less than half the 1.02% average for the top-performing active funds in their categories, and much closer to what investors pay for a passive balanced portfolio, at 0.29% on average.
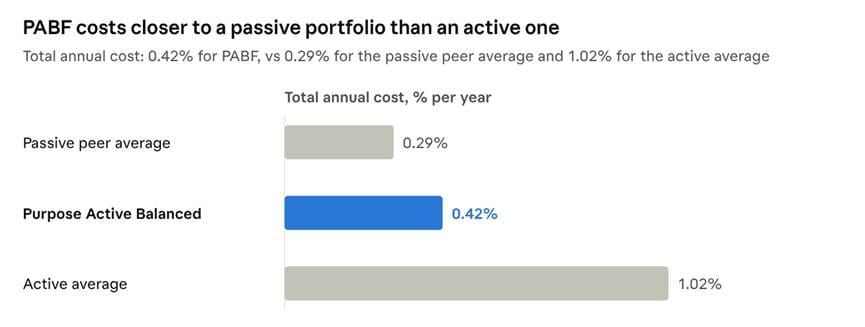
That means investors get an actively managed portfolio at a cost much closer to a passive fund than an active one.
What comes next
Purpose Active Equity Fund (PAEF) brings the same process and team to a portfolio of up to 100% stocks, with room for up to 10% in liquid alt investments, and a corporate class structure for tax efficiency, all for the same 0.20% management fee. PAEF is new, but it's built on the same framework and process behind the last three years in the Active Suite. Like the rest of the suite, it may work just as well as a core holding, or in smaller accounts (e.g. TFSA or a child's RESP).
Three years in, our job is to keep the suite simple to use and transparent about how it's managed. Sign up here to receive Craig's market insights and thought leadership content or reach out to your Purpose sales team for more questions.
— Simon Barcelon, Vice President, Product at Purpose Investments.
Sources and disclosures
Active Suite holdings of 3rd party managers vs. passive peers: Purpose Investments, Morningstar, as of October 31, 2026. Share of portfolio held in funds managed by firms other than the fund's own manager. Passive peer average is the simple average of the three largest balanced all-in-one ETFs in Canada by assets, which are largely index-based, based on publicly available information; investment strategies, fees and objectives may differ. For illustrative purposes only.
Active Suite regional weights vs. passive peers: Bloomberg, Morningstar, Purpose Investments, as of Oct. 31, 2026. Passive peer average = the three largest balanced all-in-one ETFs in Canada by assets, which are largely index-based. Latin America (under 1% in both) not shown.
Active Suite costs vs. passive peers vs. active average: Morningstar, Purpose Investments, fund manager reports, as of Nov. 19, 2026. Total annual cost is the fund expense ratio: management expense ratio plus trading costs. PABF's is from its annual management report for the period ended Dec. 31, 2025. Active average is the simple average of the fund expense ratios shown on Morningstar.ca for the 31 actively managed Series F mutual funds ranked in the top 10% of the Canada Fund Global Neutral Balanced category over one year. Passive peer average is the simple average of the fund expense ratios shown on Morningstar.ca for the three largest balanced all-in-one ETFs in Canada by assets, which are largely index-based.
Standard performance, ETF series, as of October 31, 2026 (annualized for periods over one year):
|
Fund |
1
year |
3
years |
Since
inception |
|
Purpose Active Conservative ETF (PACF) |
6.45% |
11.82% |
11.89% |
|
Purpose Active Balanced ETF (PABF) |
10.21% |
14.81% |
14.91% |
|
Purpose Active Growth ETF (PAGF) |
12.56% |
18.32% |
18.27% |
Suite inception: October 24, 2023. PAEF launched in November 2026; its performance will be reported once it has a full year of history.
- Performance and Morningstar category ranks: Morningstar Direct, as of October 31, 2026. Categories: PACF, Canada ETF Global Fixed Income Balanced; PABF, Canada ETF Global Neutral Balanced; PAGF, Canada ETF Global Equity Balanced.
- Peer average: simple average of the three largest balanced all-in-one ETFs in Canada by assets, which are largely index-based. Drawdown, volatility and Sharpe ratio cover the three years from October 31, 2023 (Purpose Investments, Bloomberg). Peer returns from Morningstar Direct.
- Turnover: latest annual management reports of fund performance (fiscal years ended December 31, 2025 or March 31, 2026).
- Regional equity weights and regional returns: Bloomberg, Morningstar, Purpose Investments, as of October 31, 2026. Regional returns are total returns in CAD since November 4, 2025.
- PAEF positioning: Purpose Investments, as of October 31, 2026, based on the indicative model portfolio; subject to change. PAEF may invest up to 10% of net assets in alternative ETFs, which may use leverage, short selling and derivatives.
Commissions, trailing commissions, management fees and expenses all may be associated with investment funds. Please read the prospectus before investing. If the securities are purchased or sold on a stock exchange, you may pay more or receive less than the current net asset value. Investment funds are not guaranteed, their values change frequently and past performance may not be repeated. The indicated rates of return are the historical annual compounded total returns including changes in unit value and reinvestment of all distributions, and do not take into account sales, redemption, distribution or optional charges or income taxes payable by any unitholder that would have reduced returns. Certain statements in this article are forward-looking and subject to risks and uncertainties; actual results may differ materially.


