
In 1998, I finished the three CFA exams, often flexing the exams were completed successively. Added a degree in Economics and Psychology (pretty good at math), a few years experience as an advisor, and the journey began to try and solve the market.
Fast forward a few years, enter my co-manager (and often co-author), who is a CMT. That is Chartered Market Technician, which is focused more on analyzing price charts looking for support, resistance or where a stock is going next. We think this is a pretty good combination that helps our investment process thanks to differing foundational approaches.
Years ago, I used to joke the CMT is like the CFA, but without math or words. Teasing and simplifying that technicians focus on charting. But the joke may be on us CFAs, as it would appear today’s market doesn’t care about a discounted cash flow, valuations, or balance sheet as much as it used to.
Royal Bank for instance, at $290 as of July 6, 2026, is trading at 17.2x forward estimates. With data back to the mid 1990s, Royal Bank never got above 15x. And the only two times it got close to 15x was in 1998 when the big banks were making a run at merging with one another and in 2006 when some were toying with becoming income trusts. Regulators quashed the merging initiative and changed the tax on income trusts to remove that potential corporate tax sidestep.
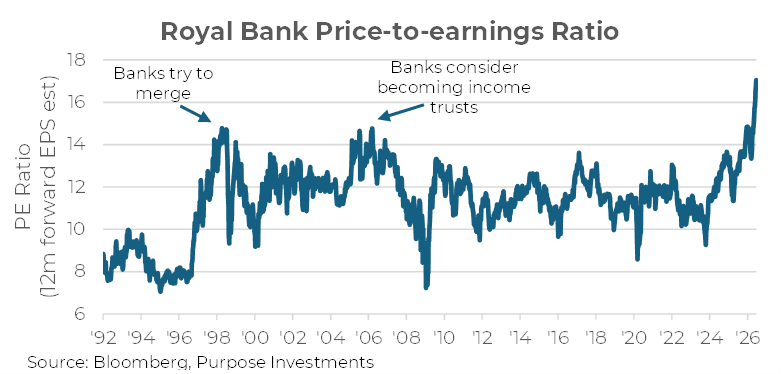
The CFA says this is bit ridiculous. Capital markets are good, but loan growth is pretty stagnant given the prevailing real estate softness and corporate loan growth challenges. And let’s not forget the banks are kind of a proxy for the Canadian economy, which just had two negative quarterly GDP prints and no USMCA deal. Does that sound like an environment you should pay a high premium for bank earnings?
The CMT says who cares about the valuations and GDP, in our view, the share price appears to have strong upward momentum. Should that change, we would reassess our position. When that changes, we will change our view. Certainly acknowledging the shares are overbought. In fact, if you take the S&P/TSX 60 Index and rank the members by their relative strength (measures momentum over 14 days), four of the big banks sit at the top of the list. This is odd, as the banks are usually in the middle. But until it breaks down, the trend is your friend.
So, why do we think market technicians have the advantage in today’s market? Lately, it seems money flows are dominating other factors and driving prices. As a proxy for flows into the Canadian market, we tracked the 20 largest broad market ETFs (based on AUM) measuring the one-month rolling in/out flows, in the following chart. Clearly not a perfect measure as money could be coming out of other smaller ETFs or funds and into the big ETFs. So, take the magnitude of the flows with a grain of salt, but the directionality is likely spot on.
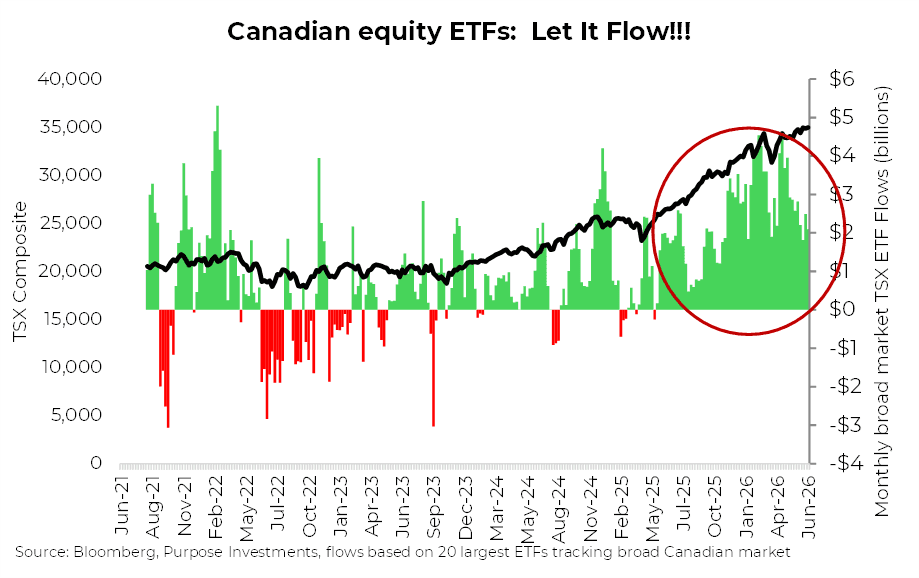
Simple fact: flows into Canadian equities have been very strong and above normal for much of 2025 and into the 1st half of 2026. The flows kicked off right after the tariff induced global sell-off near the end of Q1 2025. Since then, the S&P/TSX Composite Index has gained +44%, beating global equities as measured by the Bloomberg World Index (+35%) and the S&P 500 (+33%).
The flows go in the opposite direction as well. SpaceX, the world’s largest IPO, is rapidly being added to many indices that are tracked by billions, or trillions, of assets. To make room, all other holdings must be sold down, which is creating systematic selling of other index constituents. Given the rise of passive assets, this is a material flow. Add active managers that may have reduced other holdings to raise cash for the IPO. Plus, we may see OpenAI and Anthropic mega IPOs in the near term, that is a lot of required selling.
This systematic selling pressure from a flow perspective is taking a toll on many other names. For instance Microsoft has fallen -18% during the month of June. Sure, there are other factors at play here, but we would bet flows are the biggest. This has pushed Microsoft’s price-to-earnings ratio down to 19x, below the broader S&P 500’s multiple of 20x. The only other time the company traded below the market multiple was in the 2011-13 period after missing mobile, suffering from global PC declining sales and before its cloud dominance got going. It was viewed as a value trap back then with limited growth while today estimates keep rising with estimates at $17.08 for 2026 and $19.51 for 2027 (+14% growth).
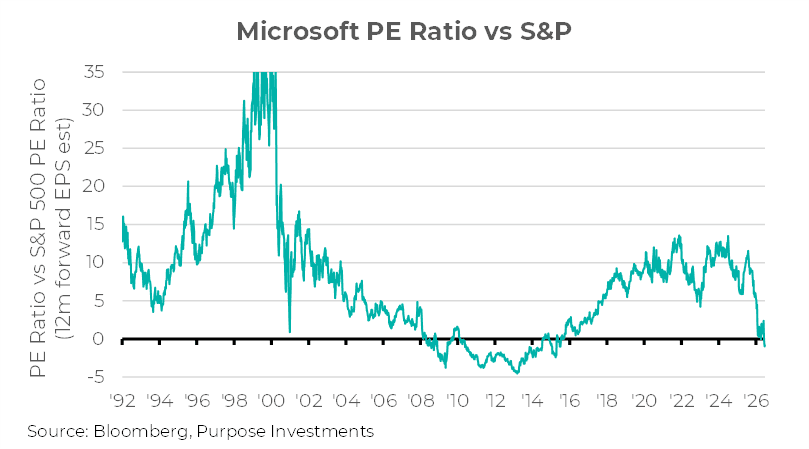
Flows, related to these mega IPOs, helps explain why the Mag 7 is flat on the year while the NASDAQ and S&P are both up about 10%. Flows are not everything. Sure, Apple raising prices due to higher input costs isn’t great news. Ideally, they raise prices because of strong demand, but the negative price reaction is likely exacerbated by the flow situation like Microsoft.
Simple takeaway: prices tend to follow the direction of flows. But, after such a run even if flows slow down, it may be hard for prices not to mean revert. Perhaps a troubling trend in the ‘Let It Flow’ chart is prices have grinded higher while flows have moderated somewhat. Still materially positive but not the pace of previous months.
Unfortunately, forecasting flows or the mood of risk appetite among investors is largely unknowable. And subject to rapid change on any sudden news. This is where the Market Technician has an advantage. They don’t have any great insight into future flows either, but if flows change it will likely quickly translate in a change in price. That can be charted and measured, enabling this discipline to pick up on changes faster than other, more fundamentally driven approaches.
Canada’s One Trade Keeps Changing Hands
Canada is increasingly becoming a one trade market. As we mentioned, the banks and other Financials have some of the strongest momentum on the TSX Composite and they have been driving the financial sector for the past couple of years. The Canadian banks are now 26% of the TSX and roughly 80% of the entire financials sector, which has grown to a 36% weight. As seen in the charts below, Financials have grown by around 7% over the past couple of years, largely at the expense of Industrials, which have declined as a percentage of the TSX by almost 5% over that same period.
Looking back, Financials are approaching their peak weight of 38% set back in Q4 2015. For those with a long memory, this was when gold was bottoming from a four-year bear market and hovering just above $1,000/oz and oil was trading at less than $40 a barrel. Truly dark days for commodity producers in Canada. Oddly enough, Energy was still a larger part of the TSX Composite back then than it is today, 19% compared to 16%.
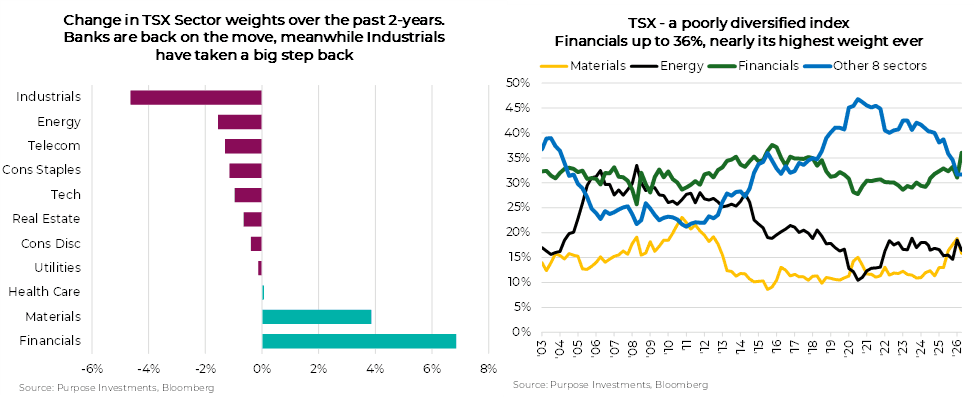
These shifting sector sands only emphasize how much of a single trade Canada is becoming now that the momentum has swung to the already dominant sector. Unlike the U.S., which has been a one trade market for some time driven by a single secular theme (AI capex), Canada's is more of a rotation, from gold to energy and now to banks, each handoff passing a momentum baton. Fortunately for most Canadians, these three sectors are the largest on the TSX, so the rotation has been a tailwind even for passive allocators. But this handoff is different. Gold and energy could each roll over without much collateral damage. Financials at 36% are another matter. The money may still rotate, but the sector is now so large it has its own gravity, much like Jupiter: when it moves, everything around it moves too. A handoff from a sector this size pulls the whole index along with it.
When (Not If) the Momentum Turns
You cannot value your way into owning banks here, and you cannot value your way out of them. The only discipline that tells you when this trade and other high momentum trade is over is watching the price. For a technician, price and volume are the be-all and end-all. Price breaks the trendline, volume confirms whether the break is real. But "watch the price" is useless unless you decide in advance what you're watching for and have a plan in place. Riding a high momentum name or sector becomes more of a trading endeavor than just a buy and hold investment.
The deviation from the fundamentals in a strong trend means that every early signal to sell can easily be confused as buy. The first thing to respect is that overbought is not a sell signal in isolation. RSI at 80 on the banks says the momentum is strong and the trend is powerful, not necessarily that its end is imminent. Strong trends can stay overbought sometimes for months.
So, watch for cracks in a specific order.
- Momentum negative divergence: Price makes a new high while RSI makes a lower high, meaning buyers are still winning but with less force each time.
- Trend-strength decay: Monitor trend strength indicators such as the ADX/ADXR line. The danger sign is not a high reading but a high reading that rolls over. TD is near 49.6 and RBC at 46.2 say the trend is about as strong as trends get, which historically sits closer to exhaustion. When ADX peaks and turns down while price stays elevated, conviction is fading even before price breaks.
- Trendline break on volume: Draw a line connecting the rising lows of the bank run, and when price closes below it on expanding volume, that’s confirmation of a trend break rather than a routine pullback.
- Monitor relative strength: Because Canada only has a few sectors that can absorb real volumes, another good signal may not be banks breaking in isolation but gold or energy quietly out-performing.
None of this predicts the top, and it isn't meant to. The point of a rules-based approach is that it strips out the two emotions that destroy returns in a mature trend: the greed that says "just a little more" as the yellow flags pile up, and the paralysis that waits for confirmation means a 20% drawdown. The other way to manage risk is by sizing appropriately, trimming a winning trade on a strong run is a reliable way to lock in profit along the way. As the old line goes, the trend is your friend until the end when it bends, and the banks have been a very good friend to the TSX Composite and to passive Canadian investors for two years running. Friendship doesn't require you to ignore the bend.
Market Cycle
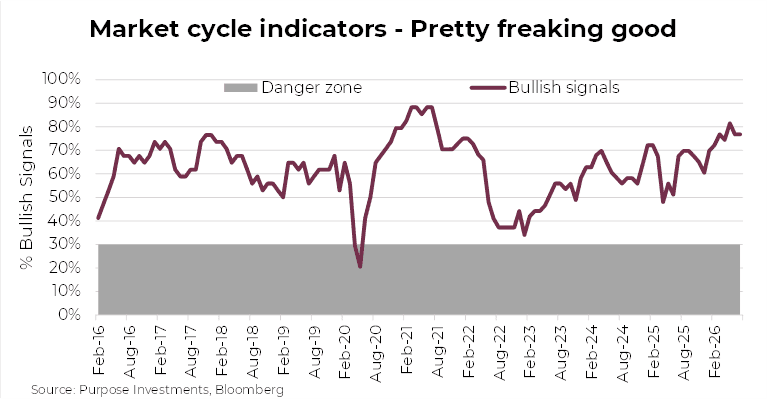
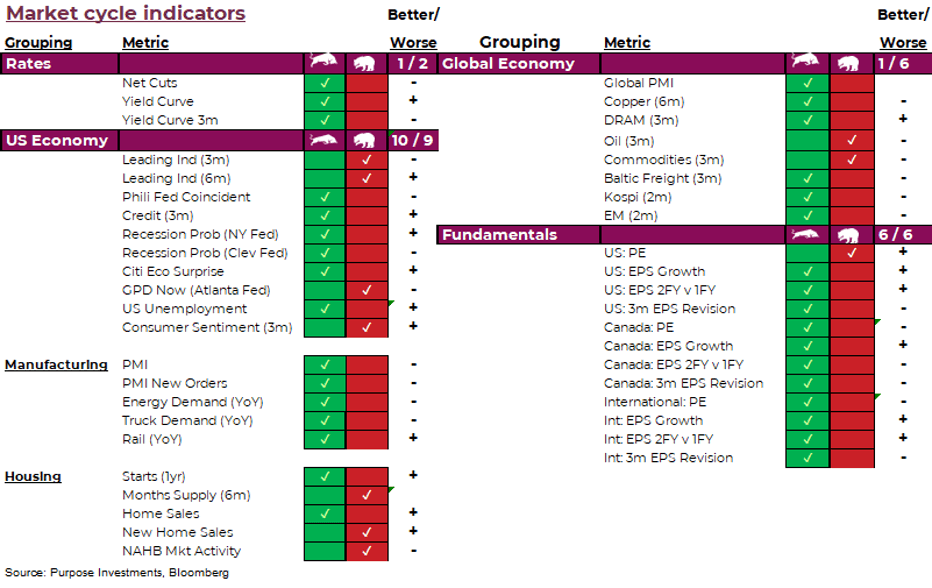
Market cycle indicators remain very healthy. Direction of rates remains positive, albeit less so than before with Fed cuts becoming more unlikely. Yield curve steepness is positive. The U.S. economic data is good. Leading indicators still bearish, that is not new news, while recession probabilities flipped from bearish to bullish. Downside, GDP Now turned bearish. Otherwise manufacturing still strong and housing mixed on the weaker side.
A little ditty on GDP Now. Official GDP is rather delayed, released 3 weeks after the quarter ends and then revised multiple time over the following months. GDP Now, from the Atlanta Fed, attempts to use proxy measures of GDP components that are more timely. This metric turned bearish as it dropped below 2%, largely due to net exports. Two big factors at work on U.S. trade is the data center buildout and energy. Most the components of those data centers are made outside the U.S., so this is driving higher imports and as prices go up so does the value of imports. Energy, oil, LNG, etc., saw really strong exports during the closure of the Strait of Hormuz. With prices down and likely volumes, value of exports likely falling fast. The core pieces of GDP, consumer & business spending, remain pretty stable so not much to be worried about here for now.
Global Economy indicators saw two signals turn bearish, both commodity price related. Oil and commodities in general saw prices fall over the past month. This is more driven by the Strait disruption than changes in aggregate demand. So not an issue here either.
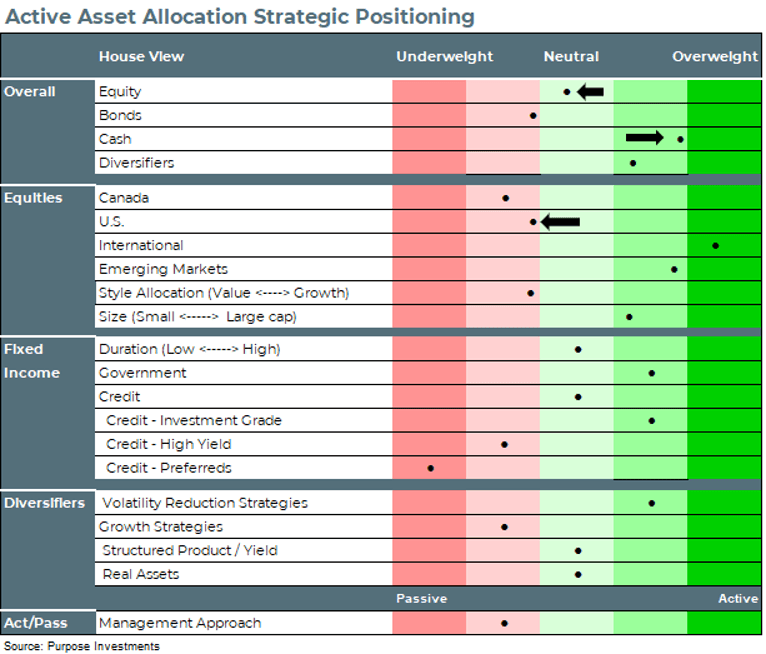
Purpose Investments did make some portfolio positioning changes last month. They had entered a position in software in February as the sector got hammered due to concerns AI was going to disrupt many of their SaaS business models. As the negative narrative cooled, shares rebounded and we exited the position, leaving proceeds in cash. This moved the overall equity allocation down slightly and increased cash dry powder.
Overall, we have a slightly defensive stance. Encouraged by economic and earnings data, we have a defensive tilt mainly due to the market already pricing in a lot of good news and our opinion this is a late cycle stage.
Final Thoughts
As flows continue to have an outsized impact on asset prices, don’t fret valuations as much and instead watch momentum for any signs of turning. Given our view this is late cycle, we would expect to see bigger market moves especially given high levels of concentration, not just in technology but even in banks for some indices. Be opportunistic and don’t be afraid to take profits. We have all enjoyed above average returns over the past few years, in the coming quarters it may be more about protecting those gains as opposed to chasing things higher.
— Craig Basinger & Derek Benedet at Purpose Investments.
Get the latest market insights in your inbox every week.
Sources: Charts are sourced to Bloomberg L.P.
The content of this document is for informational purposes only and is not being provided in the context of an offering of any securities described herein, nor is it a recommendation or solicitation to buy, hold or sell any security. The information is not investment advice, nor is it tailored to the needs or circumstances of any investor. Information contained in this document is not, and under no circumstances is it to be construed as, an offering memorandum, prospectus, advertisement or public offering of securities. No securities commission or similar regulatory authority has reviewed this document, and any representation to the contrary is an offence. Information contained in this document is believed to be accurate and reliable; however, we cannot guarantee that it is complete or current at all times. The information provided is subject to change without notice.
Commissions, trailing commissions, management fees and expenses all may be associated with investment funds. Please read the prospectus before investing. If the securities are purchased or sold on a stock exchange, you may pay more or receive less than the current net asset value. Investment funds are not guaranteed; their values change frequently, and past performance may not be repeated.
Certain statements in this document are forward-looking. Forward-looking statements (“FLS”) are statements that are predictive in nature, depend on or refer to future events or conditions, or that include words such as “may,” “will,” “should,” “could,” “expect,” “anticipate,” “intend,” “plan,” “believe,” “estimate,” or other similar expressions. Statements that look forward in time or include anything other than historical information are subject to risks and uncertainties, and actual results, actions, or events could differ materially from those set forth in the FLS. FLS are not guarantees of future performance and are, by their nature, based on numerous assumptions. Although the FLS contained in this document are based upon what Purpose Investments and the portfolio manager believe to be reasonable assumptions, Purpose Investments and the portfolio manager cannot assure that actual results will be consistent with these FLS. The reader is cautioned to consider the FLS carefully and not to place undue reliance on them. Unless required by applicable law, it is not undertaken, and is specifically disclaimed, that there is any intention or obligation to update or revise FLS, whether as a result of new information, future events, or otherwise.


