
If you have been a reader of Portfolios with a Purpose for a while, you have probably noticed by now that we spend a fair amount of time looking under the hood of advisor portfolios.
Through our Partnership Program, we have a growing sample of advisor teams and their model portfolios, which gives us unique insights into how portfolios are being built. This sample is geographically broad, mostly HNW managers at independents and banks. We have shared some of the observations in the past, like how allocations are shifting, where managers are finding opportunities and where the major bets lie. There is value in sharing information, it does not mean everyone should be doing the same thing. The intention is to offer a reference point that is difficult to get when you are locked in on your own portfolio.
What we have not really done before is take a step back and simply ask, ‘what are the most popular holdings?’ Not which funds have performed the best or which are the most compelling, but which investments are showing up the most often across the portfolios in the program.
So that is what we did. We looked across the 57 models in the portfolio and pulled out some data on the most common funds in the program. Some results are not particularly surprising, but there are a few interesting insights which we will lay out below. In some cases, managers reach for the same tool, in others, there is very little agreement. When it comes to portfolio construction, there is certainly more than one way to crack an egg.
The Shortlist
The first thing that stands out is that there is considerably more agreement in some parts of the portfolio than others.
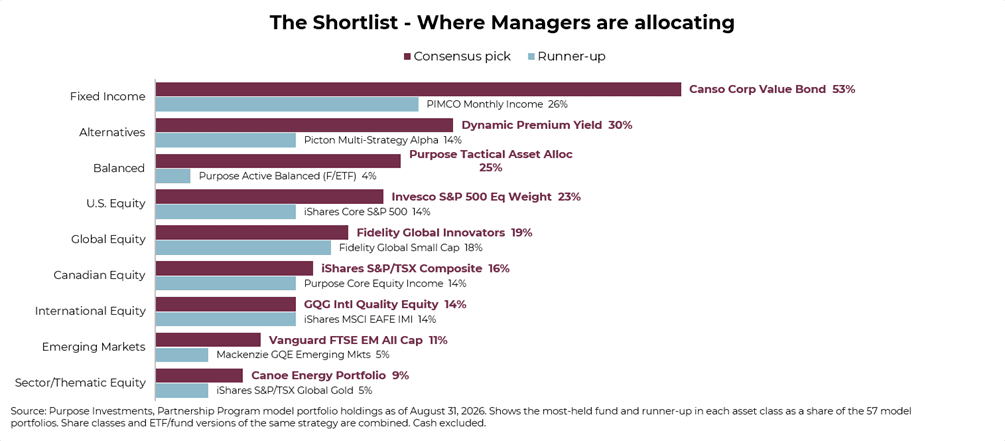
The most commonly held fixed-income fund is the Canso Corporate Value Bond, which appears in 53% of portfolios across the program. That is a fairly significant level of consensus compared with the rest of the portfolio. 23% higher than the next consensus position, which is the many forms of Dynamic Premium Yield at 30%. The next most common is our flagship fund in the balanced category, the Purpose Tactical Asset Allocation Fund, which allows portfolios to shift back and forth between bonds and equity based on momentum. Many teams in the program use this as a sidecar strategy in their portfolio so they do not have to think about asset allocation shifts.
Once we move into equities, the share of portfolios starts to decrease. The most common U.S. equity solution is some form of the Invesco S&P 500 Equal Weight is led by Fidelity Global Innovators, and Canadian equity is mostly passive exposure through the iShares S&P/TSX Composite. As we move down into international and sector exposures, the numbers get even smaller, mainly because these exposures are limited in general in portfolios. There is not as much consensus when it comes to equities because there are just so many options available. Equity sleeves give managers considerably more room to express their views. The result is a lot more variation in how managers are getting to the same place.
That difference becomes even more clear when we look at everything from a more aggregate view. Looking at the most popular fund choices only tells us part of the story. To get a better sense, we looked only at portfolios that have exposure to each asset class, then asked how many of those portfolios hold the single most popular fund, and how many hold at least one of the top five. Among portfolios with fixed income exposure (52), 58% hold the most popular fund and 81% hold at least one of the top five. In international equity, only 18% hold the most popular fund, while 68% hold one of the top five.
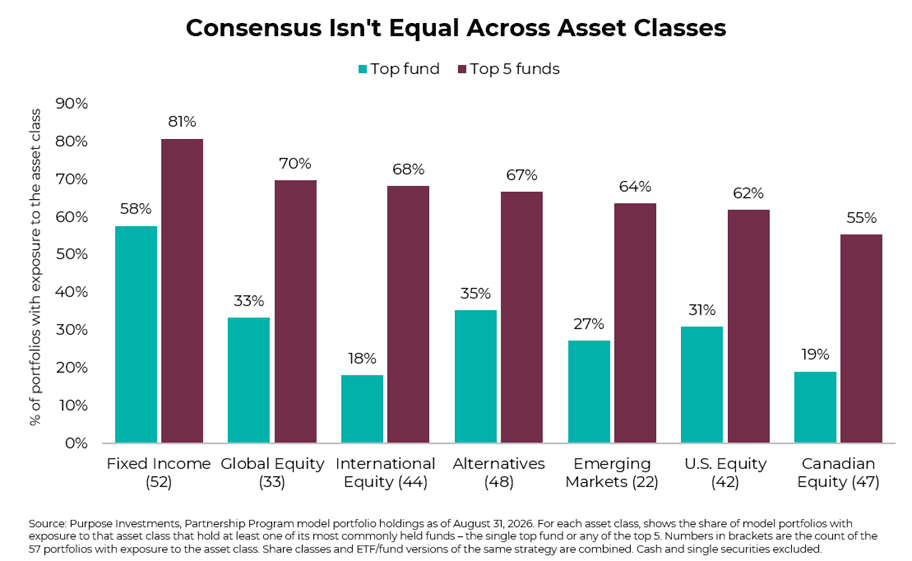
The level of dispersion is particularly interesting in Canadian equities. We are in Canada, after all, and Canadian equity portfolios have historically had no shortage of managers with strong followings and different approaches to the relatively same market. That shows up in the data, with Canadian equity having the lowest concentration among the top five funds. There is clearly no shortage of ways for a Canadian portfolio manager to build a Canadian equity sleeve, even when everyone is ultimately investing in the same underlying market.
There can be agreement about the role an asset class should play in a portfolio, which you can see by the number of portfolios holding the asset classes, but there can be some disagreement on how to implement it. That distinction becomes even more interesting when we look at the active and passive decisions underneath those allocations.
Active or Passive
Once you choose the asset class you are going to invest in, the next choice is should I go active or passive? The results below are not the usual debate about fees or performance, but what portfolio managers are actually doing.
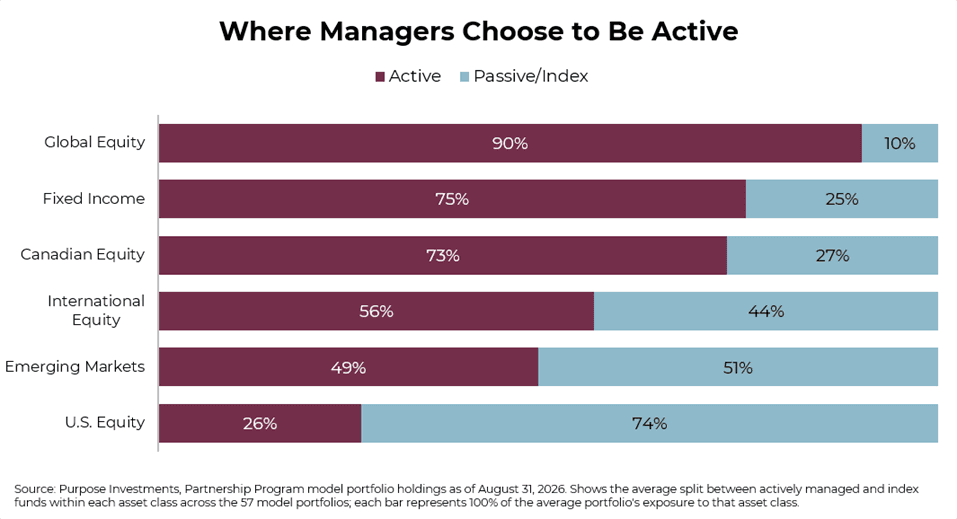
The split between active and passive varies considerably depending on the asset class. Global equity has 90% active exposure in the sample compared with 75% in fixed income, and 73% in Canadian equity. International equity is closer to an even split, and the US has the lowest active exposure at 26%.
There is certainly an interesting home country dynamic happening here. Canadian portfolio managers are much more likely to be active here than they are in the U.S. In your home market, you are closer to the companies and industries that make up the market. If part of the value of active management comes from having an informational or analytical edge, it makes sense that managers would be more willing to express or align their views with a fund manager where they know the market best. I think that makes sense, I think we all feel much more comfortable with Royal Bank's dealings than a company in Silicon Valley.
The U.S. is a much different proposition. It is clearly a larger and more heavily researched market with an enormous number of investors and analysts. For a Canadian manager, the case for trying to outsmart the entire market may simply be less obvious. That does not make passive the wrong decision, but perhaps the question being answered is not whether this comes from belief in active management and more about whether or not there is a perceived edge.
The above chart shows that a shocking 74% of the U.S. equity exposure is indexed. That is a worthy number to dive a little deeper on. There are many ways to get passive U.S. equity exposure. A majority choose some form of market cap exposure, followed by Equal Weight, Factor and then some Nasdaq.
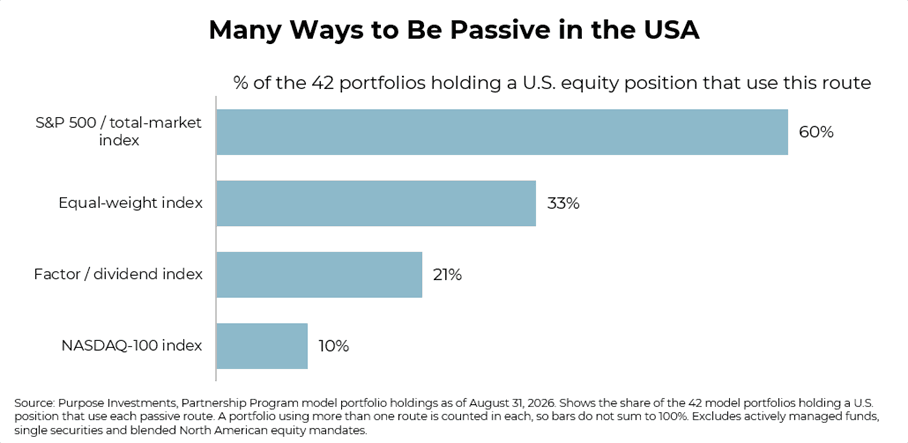
What this shows is that within the passive portion of a portfolio, there is plenty of room to make a decision. These are all passive, but they do not have the same exposure and can have very different return profiles. One is simply looking to capture the broad market, another is reducing concentration, and the other is using a set of rules to tilt toward particular characteristics. Taking it one step further, it is important to note that the global equity funds in the program carry an average US equity weight of 58%. Of the 33 holders of global equity, 19 of them pair some form of passive exposure with it. So, a majority are getting some passive beta and pairing it with some active U.S. exposure through global equity.
One thing is clear: rather than choosing an active or passive philosophy for the whole portfolio, most of the advisors in our sample appear to be making that decision one asset class at a time.
One Last Wrinkle
There is a problem with simply ranking funds by how many teams own them. Popularity tells us how widely a fund is used, but it does not tell us how important that position is within the portfolios that own it.
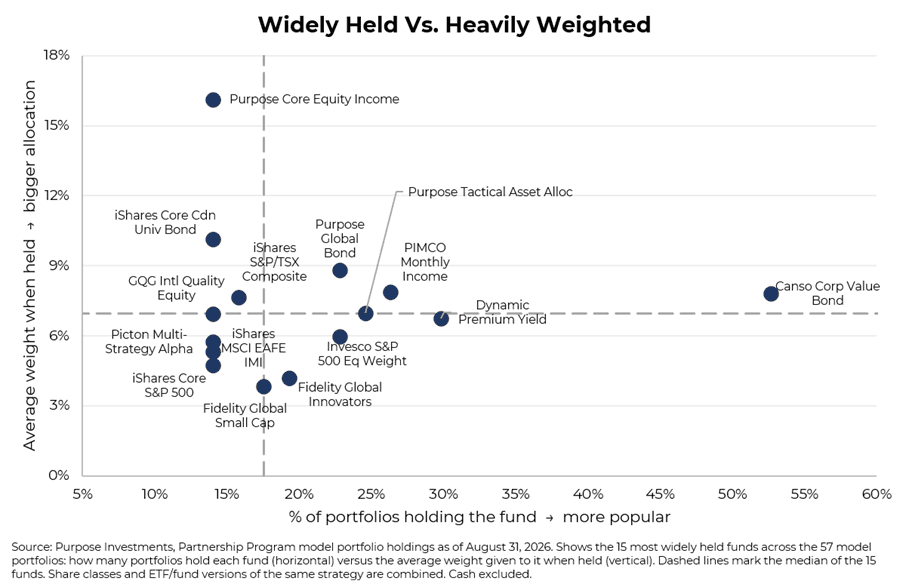
Canso is the obvious example, showing extreme levels of popularity, but a moderate weight level in portfolios. Purpose Core Equity Income is the opposite of that, held in a moderate number of portfolios but at a much stronger conviction level than any other position when held.
Those are very different roles in a portfolio. It is a good reminder that popularity only tells us how many managers own something, not how important that position is in the portfolio. Keep that in mind the next time you hear about a new fund that a colleague is excited about or see a product showing up repeatedly in portfolios. It is interesting that they own it, but the more useful question might be: how much do they actually own? Popularity and importance are not the same thing.
Final Thoughts
There is no perfect portfolio hiding somewhere in the dataset waiting to be copied, if you came here for that, I deeply apologize. What is useful, even for us, is having the ability to step outside our own portfolio and see how other managers are solving the same problems. It does not tell us what will work best moving forward, but it does show where there is consensus and disagreement. Portfolio management can be fairly isolated. Knowing the most common fund across models can be useful, but understanding why managers are using it, how large the position is and what alternatives are being used tells us considerably more.
At the end of the day, every portfolio still has to make sense on its own. A popular fund is not automatically a good fit, and a fund nobody else owns is not automatically a bad idea. The benefit of seeing what others are doing is simply that it gives you another set of questions to ask. Sometimes you find a new idea, and occasionally you look at something you own and think, ‘why the hell do I own this again?’ That is probably a worthwhile exercise every now and then.
— Brett Gustafson, Associate Portfolio Manager at Purpose Investments
Sources: Charts are sourced to Bloomberg L.P.
The content of this document is for informational purposes only, and is not being provided in the context of an offering of any securities described herein, nor is it a recommendation or solicitation to buy, hold, or sell any security. The information is not investment advice, nor is it tailored to the needs or circumstances of any investor. Information contained in this document is not, and under no circumstances is it to be construed as, an offering memorandum, prospectus, advertisement or public offering of securities. No securities commission or similar regulatory authority has reviewed this document and any representation to the contrary is an offence. Information contained in this document is believed to be accurate and reliable, however, we cannot guarantee that it is complete or current at all times. The information provided is subject to change without notice.
Commissions, trailing commissions, management fees, and expenses all may be associated with investment funds. Please read the prospectus before investing. If the securities are purchased or sold on a stock exchange, you may pay more or receive less than the current net asset value. Investment funds are not guaranteed, their values change frequently and past performance may not be repeated. Certain statements in this document are forward-looking. Forward-looking statements ("FLS") are statements that are predictive in nature, depend on or refer to future events or conditions, or that include words such as "may," "will," "should," "could," "expect," "anticipate," intend," "plan," "believe," "estimate" or other similar expressions. Statements that look forward in time or include anything other than historical information are subject to risks and uncertainties, and actual results, actions or events could differ materially from those set forth in the FLS. FLS are not guarantees of future performance and are by their nature based on numerous assumptions. Although the FLS contained in this document are based upon what Purpose Investments and the portfolio manager believe to be reasonable assumptions, Purpose Investments and the portfolio manager cannot assure that actual results will be consistent with these FLS. The reader is cautioned to consider the FLS carefully and not to place undue reliance on the FLS. Unless required by applicable law, it is not undertaken, and specifically disclaimed, that there is any intention or obligation to update or revise FLS, whether as a result of new information, future events or otherwise.